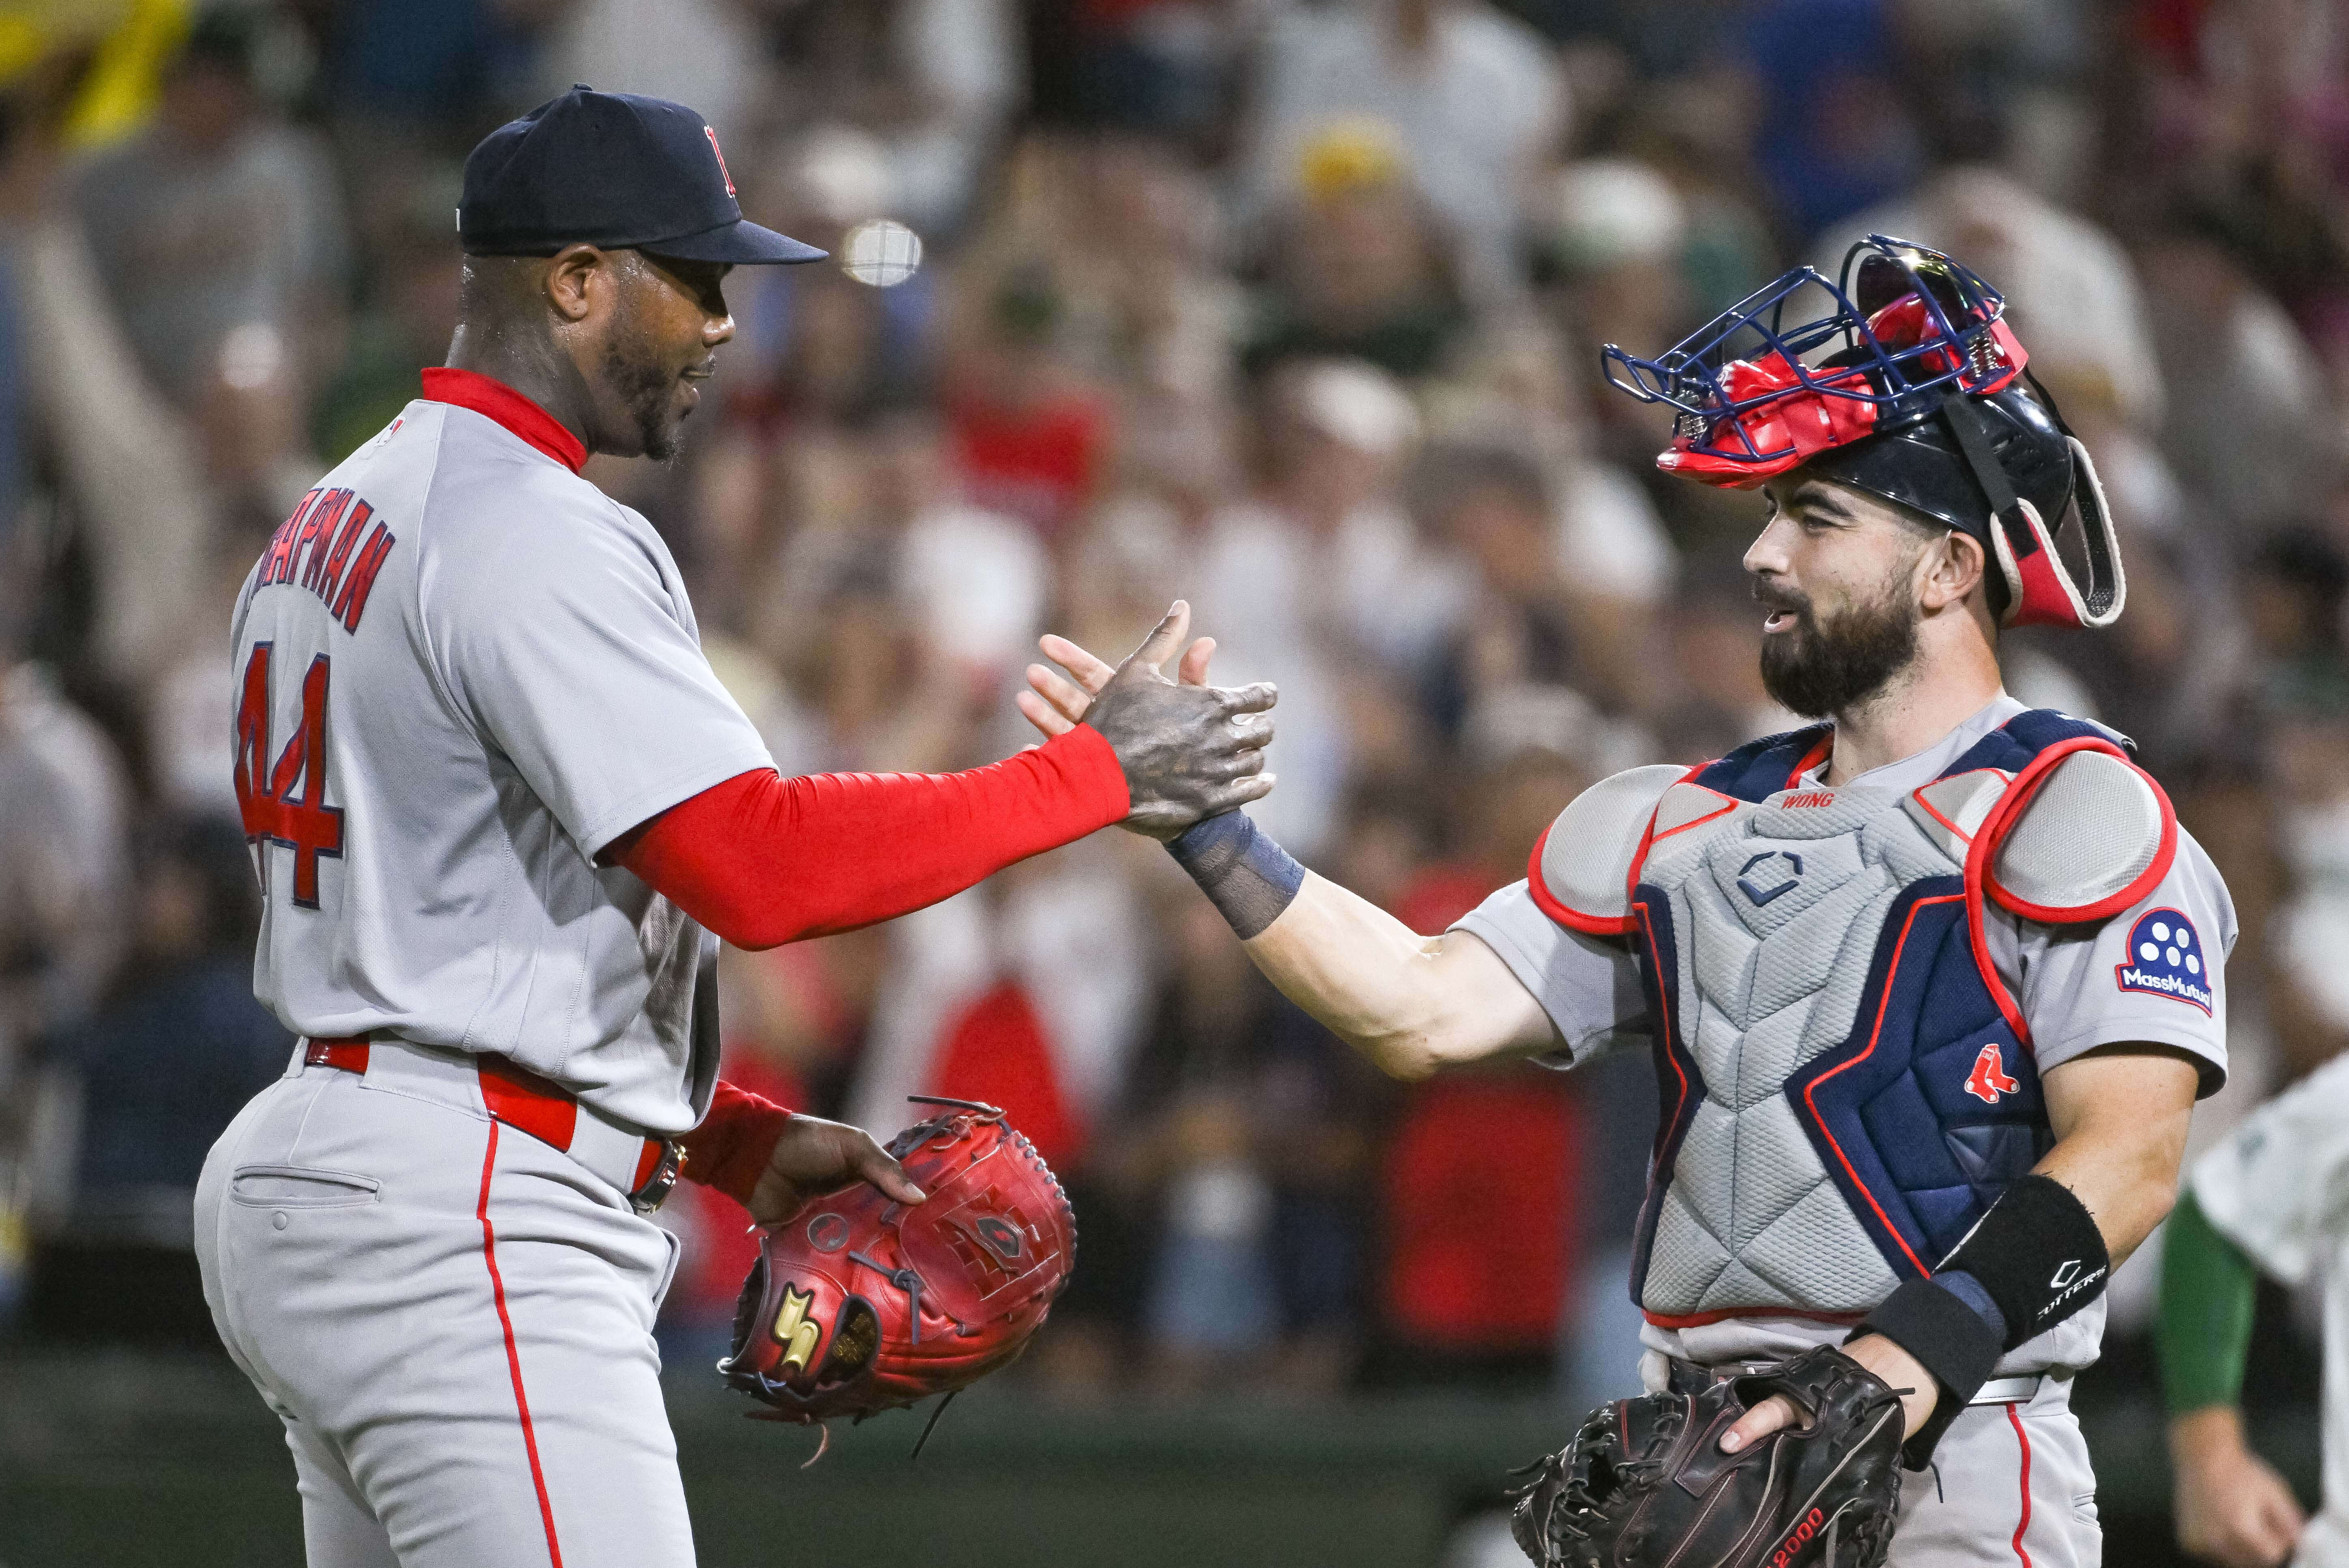
MLB Betting Stats 2025 2025
League Leaders - Teams
Top 5 Pitching
#Team | ERA | OBP | OPS | SO |
---|---|---|---|---|
1
|
3.47 | .295 | .669 | 1344 |
2
|
3.58 | .305 | .677 | 1432 |
3
|
3.63 | .302 | .672 | 1425 |
4
|
3.70 | .310 | .694 | 1381 |
5
|
3.70 | .316 | .691 | 1361 |
Top 5 Money
#Team | W/L | $ | HM $ | AW $ |
---|---|---|---|---|
1
|
79-83 | 2103 | 88 | 2015 |
2
|
97-65 | 2029 | 1058 | 971 |
3
|
94-68 | 1677 | 1746 | -69 |
4
|
88-74 | 1579 | 295 | 1284 |
5
|
90-72 | 852 | 1138 | -286 |
Batting Leaders
Top 5 Batting Average
#Player | AVG |
---|---|
1 Aaron Judge | .331 |
2 Bo Bichette | .311 |
3 Jacob Wilson | .311 |
4 George Springer | .309 |
5 Trea Turner | .304 |
Top 5 Home Runs
#Player | HR |
---|---|
1 Cal Raleigh | 60 |
2 Kyle Schwarber | 56 |
3 Shohei Ohtani | 55 |
4 Aaron Judge | 53 |
5 Junior Caminero | 45 |
Top 5 Runs Batted In
#Player | RBI |
---|---|
1 Kyle Schwarber | 132 |
2 Pete Alonso | 126 |
3 Cal Raleigh | 125 |
4 Aaron Judge | 114 |
5 Vinnie Pasquantino | 113 |
Top 5 Runs
#Player | R |
---|---|
1 Shohei Ohtani | 146 |
2 Aaron Judge | 137 |
3 Juan Soto | 120 |
4 Francisco Lindor | 117 |
5 Kyle Schwarber | 111 |
Pitching Leaders
Top 5 Starter Money
#Name | Team | W/L | $ |
---|---|---|---|
1 Lucas Giolito | BOS | 18-8 | 995 |
2 Robbie Ray | SF | 22-10 | 930 |
3 Quinn Priester | MIL | 17-7 | 866 |
4 Eric Lauer | TOR | 12-3 | 849 |
5 Trevor Rogers | BAL | 13-5 | 848 |
Top 5 Starter O/U
#Name | Team | O/U | % |
---|---|---|---|
1 Yusei Kikuchi | LAA | 21-12 | 63.6 |
2 Jacob deGrom | TEX | 18-12 | 60.0 |
3 Jose Berrios | TOR | 18-12 | 60.0 |
4 Sonny Gray | STL | 18-13 | 58.1 |
5 Jose Soriano | LAA | 18-13 | 58.1 |
Top 5 Wins
#Player | Wins |
---|---|
1 Max Fried | 19 |
2 Carlos Rodon | 18 |
3 Garrett Crochet | 18 |
4 Freddy Peralta | 17 |
5 Jesus Luzardo | 15 |
Top 5 Earned Run Average
#Player | ERA |
---|---|
1 Paul Skenes | 1.97 |
2 Tarik Skubal | 2.21 |
3 Hunter Brown | 2.43 |
4 Yoshinobu Yamamoto | 2.49 |
5 Cristopher Sanchez | 2.50 |
Top 5 Saves
#Player | SV |
---|---|
1 Carlos Estevez | 42 |
2 Robert Suarez | 40 |
3 Andres Munoz | 38 |
4 Jeff Hoffman | 33 |
5 Jhoan Duran | 32 |
Top 5 Strikeouts
#Player | SO |
---|---|
1 Garrett Crochet | 255 |
2 Tarik Skubal | 241 |
3 Logan Webb | 224 |
4 Jesus Luzardo | 216 |
5 Paul Skenes | 216 |
Umpires
Top 5 Umpire Homer
#Name | W/L | % | $ |
---|---|---|---|
1 Laz Diaz | 22-9 | 71.0 | 995 |
2 Bill Miller | 22-10 | 68.8 | 931 |
3 Paul Clemons | 21-8 | 72.4 | 1023 |
4 Adam Hamari | 21-10 | 67.7 | 725 |
5 Mike Muchlinski | 20-10 | 66.7 | 733 |
Top 5 Umpire O/U
#Name | O/U | % | AVG |
---|---|---|---|
1 Dan Bellino | 19-9 | 67.9 | 9.9 |
2 Alfonso Marquez | 19-9 | 67.9 | 9.8 |
3 Shane Livensparger | 19-10 | 65.5 | 9.2 |
4 Doug Eddings | 19-12 | 61.3 | 9.9 |
5 Ben May | 18-11 | 62.1 | 9.7 |
League Leaders - Teams
Top 5 Pitching
#Team | ERA | OBP | OPS | SO |
---|---|---|---|---|
1
|
2.16 | .295 | .699 | 35 |
2
|
2.33 | .325 | .612 | 33 |
3
|
2.83 | .261 | .561 | 64 |
4
|
2.87 | .280 | .557 | 41 |
5
|
2.88 | .295 | .638 | 29 |
Top 5 Money
#Team | W/L | $ | HM $ | AW $ |
---|---|---|---|---|
1
|
5-2 | 365 | 464 | -245 |
2
|
6-1 | 337 | -54 | -900 |
3
|
3-3 | 71 | 1746 | -69 |
4
|
4-4 | 35 | -263 | -404 |
5
|
4-4 | -30 | 83 | -34 |
Batting Leaders
Top 5 Batting Average
#Player | AVG |
---|---|
1 Aaron Judge | .500 |
2 Ernie Clement | .476 |
3 Nico Hoerner | .419 |
4 Trevor Story | .385 |
5 Spencer Steer | .375 |
Top 5 Home Runs
#Player | HR |
---|---|
1 Michael Busch | 4 |
2 Seiya Suzuki | 3 |
3 Teoscar Hernandez | 3 |
4 Vladimir Guerrero Jr. | 3 |
5 Jorge Polanco | 3 |
Top 5 Runs Batted In
#Player | RBI |
---|---|
1 Teoscar Hernandez | 9 |
2 Vladimir Guerrero Jr. | 9 |
3 Jorge Polanco | 8 |
4 Aaron Judge | 7 |
5 Jackson Chourio | 7 |
Top 5 Runs
#Player | R |
---|---|
1 Daulton Varsho | 7 |
2 George Springer | 6 |
3 Ernie Clement | 6 |
4 Randy Arozarena | 6 |
5 Kyle Tucker | 5 |
Pitching Leaders
Top 5 Starter Money
#Name | Team | W/L | $ |
---|---|---|---|
1 Jacob Misiorowski | MIL | 3-0 | 420 |
2 Trevor Williams | WAS | 4-1 | 372 |
3 Will Warren | NYY | 4-1 | 235 |
4 Richard Fitts | BOS | 3-0 | 215 |
5 Ryan Bergert | KC | 2-0 | 183 |
Top 5 Starter O/U
#Name | Team | O/U | % |
---|---|---|---|
1 Charlie Morton | ATL | 4-0 | 100.0 |
2 Jose Berrios | TOR | 4-0 | 100.0 |
3 Sandy Alcantara | MIA | 3-0 | 100.0 |
4 Walker Buehler | PHI | 3-0 | 100.0 |
5 Jesus Luzardo | PHI | 3-0 | 100.0 |
Top 5 Wins
#Player | Wins |
---|---|
1 Blake Snell | 3 |
2 Jacob Misiorowski | 2 |
3 Will Vest | 1 |
4 Tarik Skubal | 1 |
5 Troy Melton | 1 |
Top 5 Earned Run Average
#Player | ERA |
---|---|
1 Will Vest | 0.00 |
2 Dylan Cease | 0.00 |
3 Adrian Morejon | 0.00 |
4 Tyler Glasnow | 0.00 |
5 Cade Smith | 0.00 |
Top 5 Saves
#Player | SV |
---|---|
1 Brad Keller | 2 |
2 David Bednar | 2 |
3 Roki Sasaki | 2 |
4 Andres Munoz | 2 |
5 Will Vest | 1 |
Top 5 Strikeouts
#Player | SO |
---|---|
1 Tarik Skubal | 36 |
2 Blake Snell | 28 |
3 Freddy Peralta | 15 |
4 Trey Yesavage | 15 |
5 Cam Schlittler | 14 |
Umpires
Top 5 Umpire Homer
#Name | W/L | % | $ |
---|---|---|---|
1 Jeremie Rehak | 1-0 | 100.0 | 135 |
2 Adam Hamari | 1-0 | 100.0 | 132 |
3 Lance Barksdale | 1-0 | 100.0 | 106 |
4 Alan Porter | 1-0 | 100.0 | 105 |
5 Will Little | 1-0 | 100.0 | 97 |
Top 5 Umpire O/U
#Name | O/U | % | AVG |
---|---|---|---|
1 Adam Hamari | 1-0 | 100.0 | 20.0 |
2 Nick Mahrley | 1-0 | 100.0 | 15.0 |
3 Jordan Baker | 1-0 | 100.0 | 15.0 |
4 Doug Eddings | 1-0 | 100.0 | 13.0 |
5 Lance Barrett | 1-0 | 100.0 | 12.0 |
League Leaders - Teams
Top 5 Pitching
#Team | ERA | OBP | OPS | SO |
---|---|---|---|---|
1
|
3.47 | .295 | .669 | 1344 |
2
|
3.70 | .310 | .694 | 1381 |
3
|
3.70 | .316 | .691 | 1361 |
4
|
3.73 | .306 | .698 | 1271 |
5
|
3.86 | .303 | .696 | 1504 |
Top 5 Money
#Team | W/L | $ | HM $ | AW $ |
---|---|---|---|---|
1
|
94-68 | 1677 | 1746 | -69 |
2
|
88-74 | 1579 | 295 | 1284 |
3
|
89-73 | 662 | 481 | 181 |
4
|
87-75 | 593 | 352 | 241 |
5
|
76-86 | 322 | -507 | 829 |
Batting Leaders
Top 5 Batting Average
#Player | AVG |
---|---|
1 Aaron Judge | .331 |
2 Bo Bichette | .311 |
3 Jacob Wilson | .311 |
4 George Springer | .309 |
5 Jeremy Pena | .304 |
Top 5 Home Runs
#Player | HR |
---|---|
1 Cal Raleigh | 60 |
2 Aaron Judge | 53 |
3 Junior Caminero | 45 |
4 Jo Adell | 37 |
5 Riley Greene | 36 |
Top 5 Runs Batted In
#Player | RBI |
---|---|
1 Cal Raleigh | 125 |
2 Aaron Judge | 114 |
3 Vinnie Pasquantino | 113 |
4 Riley Greene | 111 |
5 Junior Caminero | 110 |
Top 5 Runs
#Player | R |
---|---|
1 Aaron Judge | 137 |
2 Cal Raleigh | 110 |
3 Julio Rodriguez | 106 |
4 George Springer | 106 |
5 Jose Ramirez | 103 |
Pitching Leaders
Top 5 Starter Money
#Name | Team | W/L | $ |
---|---|---|---|
1 Lucas Giolito | BOS | 18-8 | 995 |
2 Eric Lauer | TOR | 12-3 | 849 |
3 Trevor Rogers | BAL | 13-5 | 848 |
4 Jackson Jobe | DET | 9-1 | 826 |
5 Jacob Lopez | ATH | 11-6 | 772 |
Top 5 Starter O/U
#Name | Team | O/U | % |
---|---|---|---|
1 Yusei Kikuchi | LAA | 21-12 | 63.6 |
2 Jacob deGrom | TEX | 18-12 | 60.0 |
3 Jose Berrios | TOR | 18-12 | 60.0 |
4 Jose Soriano | LAA | 18-13 | 58.1 |
5 Will Warren | NYY | 18-14 | 56.2 |
Top 5 Wins
#Player | Wins |
---|---|
1 Max Fried | 19 |
2 Carlos Rodon | 18 |
3 Garrett Crochet | 18 |
4 Bryan Woo | 15 |
5 Tarik Skubal | 13 |
Top 5 Earned Run Average
#Player | ERA |
---|---|
1 Tarik Skubal | 2.21 |
2 Hunter Brown | 2.43 |
3 Garrett Crochet | 2.59 |
4 Max Fried | 2.86 |
5 Bryan Woo | 2.94 |
Top 5 Saves
#Player | SV |
---|---|
1 Carlos Estevez | 42 |
2 Andres Munoz | 38 |
3 Jeff Hoffman | 33 |
4 Aroldis Chapman | 32 |
5 Kenley Jansen | 29 |
Top 5 Strikeouts
#Player | SO |
---|---|
1 Garrett Crochet | 255 |
2 Tarik Skubal | 241 |
3 Hunter Brown | 206 |
4 Carlos Rodon | 203 |
5 Bryan Woo | 198 |
Umpires
Top 5 Umpire Homer
#Name | W/L | % | $ |
---|---|---|---|
1 Laz Diaz | 14-3 | 82.4 | 1207 |
2 Adam Hamari | 14-4 | 77.8 | 1114 |
3 Nestor Ceja | 13-3 | 81.2 | 1189 |
4 Doug Eddings | 13-4 | 76.5 | 1092 |
5 Carlos Torres | 13-6 | 68.4 | 995 |
Top 5 Umpire O/U
#Name | O/U | % | AVG |
---|---|---|---|
1 Alfonso Marquez | 13-5 | 72.2 | 9.9 |
2 Gabe Morales | 13-5 | 72.2 | 9.4 |
3 Lance Barrett | 11-6 | 64.7 | 8.8 |
4 Brian Walsh | 11-7 | 61.1 | 10.6 |
5 Dan Bellino | 10-4 | 71.4 | 9.9 |
League Leaders - Teams
Top 5 Pitching
#Team | ERA | OBP | OPS | SO |
---|---|---|---|---|
1
|
2.33 | .325 | .612 | 33 |
2
|
2.83 | .261 | .561 | 64 |
3
|
2.88 | .295 | .638 | 29 |
4
|
2.91 | .279 | .615 | 82 |
5
|
5.09 | .329 | .751 | 62 |
Top 5 Money
#Team | W/L | $ | HM $ | AW $ |
---|---|---|---|---|
1
|
5-2 | 365 | 464 | -245 |
2
|
3-3 | 71 | 1746 | -69 |
3
|
4-4 | 35 | -263 | -404 |
4
|
1-2 | -83 | 481 | 181 |
5
|
1-2 | -117 | 295 | 1284 |
Batting Leaders
Top 5 Batting Average
#Player | AVG |
---|---|
1 Aaron Judge | .500 |
2 Ernie Clement | .476 |
3 Trevor Story | .385 |
4 Vladimir Guerrero Jr. | .375 |
5 Cal Raleigh | .357 |
Top 5 Home Runs
#Player | HR |
---|---|
1 Vladimir Guerrero Jr. | 3 |
2 Jorge Polanco | 3 |
3 Kerry Carpenter | 2 |
4 George Springer | 2 |
5 Daulton Varsho | 2 |
Top 5 Runs Batted In
#Player | RBI |
---|---|
1 Vladimir Guerrero Jr. | 9 |
2 Jorge Polanco | 8 |
3 Aaron Judge | 7 |
4 Kerry Carpenter | 6 |
5 Spencer Torkelson | 6 |
Top 5 Runs
#Player | R |
---|---|
1 Daulton Varsho | 7 |
2 George Springer | 6 |
3 Ernie Clement | 6 |
4 Randy Arozarena | 6 |
5 Aaron Judge | 5 |
Pitching Leaders
Top 5 Starter Money
#Name | Team | W/L | $ |
---|---|---|---|
1 Will Warren | NYY | 4-1 | 235 |
2 Richard Fitts | BOS | 3-0 | 215 |
3 Ryan Bergert | KC | 2-0 | 183 |
4 Casey Mize | DET | 3-1 | 176 |
5 Ryan Johnson | LAA | 1-0 | 159 |
Top 5 Starter O/U
#Name | Team | O/U | % |
---|---|---|---|
1 Jose Berrios | TOR | 4-0 | 100.0 |
2 Jack Leiter | TEX | 3-0 | 100.0 |
3 Spencer Arrighetti | HOU | 3-0 | 100.0 |
4 Drew Rasmussen | TB | 3-0 | 100.0 |
5 Shane McClanahan | TB | 3-0 | 100.0 |
Top 5 Wins
#Player | Wins |
---|---|
1 Will Vest | 1 |
2 Tarik Skubal | 1 |
3 Troy Melton | 1 |
4 Cam Schlittler | 1 |
5 Cade Smith | 1 |
Top 5 Earned Run Average
#Player | ERA |
---|---|
1 Will Vest | 0.00 |
2 Cade Smith | 0.00 |
3 Gavin Williams | 0.00 |
4 Garrett Crochet | 1.17 |
5 Cam Schlittler | 1.26 |
Top 5 Saves
#Player | SV |
---|---|
1 David Bednar | 2 |
2 Andres Munoz | 2 |
3 Will Vest | 1 |
4 Keider Montero | 1 |
5 Aroldis Chapman | 1 |
Top 5 Strikeouts
#Player | SO |
---|---|
1 Tarik Skubal | 36 |
2 Trey Yesavage | 15 |
3 Cam Schlittler | 14 |
4 George Kirby | 14 |
5 Jack Flaherty | 12 |
Umpires
Top 5 Umpire Homer
#Name | W/L | % | $ |
---|---|---|---|
1 Jeremie Rehak | 1-0 | 100.0 | 135 |
2 Adam Hamari | 1-0 | 100.0 | 132 |
3 Alan Porter | 1-0 | 100.0 | 105 |
4 Chris Guccione | 1-0 | 100.0 | 96 |
5 Chris Segal | 1-0 | 100.0 | 93 |
Top 5 Umpire O/U
#Name | O/U | % | AVG |
---|---|---|---|
1 Adam Hamari | 1-0 | 100.0 | 20.0 |
2 Jordan Baker | 1-0 | 100.0 | 15.0 |
3 Doug Eddings | 1-0 | 100.0 | 13.0 |
4 Chris Guccione | 1-0 | 100.0 | 12.0 |
5 John Tumpane | 1-0 | 100.0 | 12.0 |
League Leaders - Teams
Top 5 Pitching
#Team | ERA | OBP | OPS | SO |
---|---|---|---|---|
1
|
3.58 | .305 | .677 | 1432 |
2
|
3.63 | .302 | .672 | 1425 |
3
|
3.76 | .304 | .686 | 1314 |
4
|
3.79 | .304 | .697 | 1471 |
5
|
3.79 | .296 | .697 | 1265 |
Top 5 Money
#Team | W/L | $ | HM $ | AW $ |
---|---|---|---|---|
1
|
79-83 | 2103 | 88 | 2015 |
2
|
97-65 | 2029 | 1058 | 971 |
3
|
90-72 | 852 | 1138 | -286 |
4
|
83-79 | 594 | 487 | 107 |
5
|
96-66 | 376 | 1013 | -637 |
Batting Leaders
Top 5 Batting Average
#Player | AVG |
---|---|
1 Trea Turner | .304 |
2 Nico Hoerner | .297 |
3 Freddie Freeman | .295 |
4 Luis Arraez | .292 |
5 Alec Burleson | .290 |
Top 5 Home Runs
#Player | HR |
---|---|
1 Kyle Schwarber | 56 |
2 Shohei Ohtani | 55 |
3 Juan Soto | 43 |
4 Pete Alonso | 38 |
5 Michael Busch | 34 |
Top 5 Runs Batted In
#Player | RBI |
---|---|
1 Kyle Schwarber | 132 |
2 Pete Alonso | 126 |
3 Juan Soto | 105 |
4 Seiya Suzuki | 103 |
5 Christian Yelich | 103 |
Top 5 Runs
#Player | R |
---|---|
1 Shohei Ohtani | 146 |
2 Juan Soto | 120 |
3 Francisco Lindor | 117 |
4 Kyle Schwarber | 111 |
5 Fernando Tatis Jr. | 111 |
Pitching Leaders
Top 5 Starter Money
#Name | Team | W/L | $ |
---|---|---|---|
1 Robbie Ray | SF | 22-10 | 930 |
2 Quinn Priester | MIL | 17-7 | 866 |
3 Janson Junk | MIA | 10-6 | 791 |
4 Edward Cabrera | MIA | 15-11 | 729 |
5 Randy Vasquez | SD | 17-9 | 725 |
Top 5 Starter O/U
#Name | Team | O/U | % |
---|---|---|---|
1 Sonny Gray | STL | 18-13 | 58.1 |
2 Logan Webb | SF | 18-16 | 52.9 |
3 Colin Rea | CHC | 17-9 | 65.4 |
4 Eduardo Rodriguez | AZ | 17-11 | 60.7 |
5 Brandon Pfaadt | AZ | 17-12 | 58.6 |
Top 5 Wins
#Player | Wins |
---|---|
1 Freddy Peralta | 17 |
2 Jesus Luzardo | 15 |
3 Logan Webb | 15 |
4 Matthew Boyd | 14 |
5 Sonny Gray | 14 |
Top 5 Earned Run Average
#Player | ERA |
---|---|
1 Paul Skenes | 1.97 |
2 Yoshinobu Yamamoto | 2.49 |
3 Cristopher Sanchez | 2.50 |
4 Freddy Peralta | 2.70 |
5 Andrew Abbott | 2.87 |
Top 5 Saves
#Player | SV |
---|---|
1 Robert Suarez | 40 |
2 Emilio Pagan | 32 |
3 Trevor Megill | 30 |
4 Raisel Iglesias | 29 |
5 Edwin Diaz | 28 |
Top 5 Strikeouts
#Player | SO |
---|---|
1 Logan Webb | 224 |
2 Jesus Luzardo | 216 |
3 Paul Skenes | 216 |
4 Dylan Cease | 215 |
5 Cristopher Sanchez | 212 |
Umpires
Top 5 Umpire Homer
#Name | W/L | % | $ |
---|---|---|---|
1 Bill Miller | 13-5 | 72.2 | 1135 |
2 Stu Scheurwater | 13-5 | 72.2 | 969 |
3 D.J. Reyburn | 12-3 | 80.0 | 1092 |
4 Charlie Ramos | 12-4 | 75.0 | 944 |
5 Jim Wolf | 12-5 | 70.6 | 1021 |
Top 5 Umpire O/U
#Name | O/U | % | AVG |
---|---|---|---|
1 Doug Eddings | 12-3 | 80.0 | 11.1 |
2 Bill Miller | 12-6 | 66.7 | 10.7 |
3 Ryan Wills | 11-3 | 78.6 | 10.8 |
4 Clint Vondrak | 11-7 | 61.1 | 12.2 |
5 Chris Conroy | 11-7 | 61.1 | 10.6 |
League Leaders - Teams
Top 5 Pitching
#Team | ERA | OBP | OPS | SO |
---|---|---|---|---|
1
|
2.16 | .295 | .699 | 35 |
2
|
2.87 | .280 | .557 | 41 |
3
|
3.00 | .297 | .677 | 54 |
4
|
3.05 | .285 | .575 | 74 |
5
|
3.12 | .303 | .685 | 50 |
Top 5 Money
#Team | W/L | $ | HM $ | AW $ |
---|---|---|---|---|
1
|
6-1 | 337 | -54 | -900 |
2
|
4-4 | -30 | 83 | -34 |
3
|
3-3 | -71 | 1058 | 971 |
4
|
1-2 | -105 | 1138 | -286 |
5
|
1-3 | -138 | 1013 | -637 |
Batting Leaders
Top 5 Batting Average
#Player | AVG |
---|---|
1 Nico Hoerner | .419 |
2 Spencer Steer | .375 |
3 Freddy Fermin | .364 |
4 J.T. Realmuto | .353 |
5 Enrique Hernandez | .346 |
Top 5 Home Runs
#Player | HR |
---|---|
1 Michael Busch | 4 |
2 Seiya Suzuki | 3 |
3 Teoscar Hernandez | 3 |
4 Ian Happ | 2 |
5 Shohei Ohtani | 2 |
Top 5 Runs Batted In
#Player | RBI |
---|---|
1 Teoscar Hernandez | 9 |
2 Jackson Chourio | 7 |
3 Seiya Suzuki | 5 |
4 Shohei Ohtani | 5 |
5 Mookie Betts | 5 |
Top 5 Runs
#Player | R |
---|---|
1 Kyle Tucker | 5 |
2 Enrique Hernandez | 5 |
3 William Contreras | 5 |
4 Nico Hoerner | 4 |
5 Michael Busch | 4 |
Pitching Leaders
Top 5 Starter Money
#Name | Team | W/L | $ |
---|---|---|---|
1 Jacob Misiorowski | MIL | 3-0 | 420 |
2 Trevor Williams | WAS | 4-1 | 372 |
3 Bradley Blalock | COL | 3-0 | 166 |
4 Nestor Cortes | SD | 2-0 | 149 |
5 Nick Lodolo | CIN | 3-1 | 122 |
Top 5 Starter O/U
#Name | Team | O/U | % |
---|---|---|---|
1 Charlie Morton | ATL | 4-0 | 100.0 |
2 Sandy Alcantara | MIA | 3-0 | 100.0 |
3 Walker Buehler | PHI | 3-0 | 100.0 |
4 Jesus Luzardo | PHI | 3-0 | 100.0 |
5 Blade Tidwell | SF | 2-0 | 100.0 |
Top 5 Wins
#Player | Wins |
---|---|
1 Blake Snell | 3 |
2 Jacob Misiorowski | 2 |
3 Adrian Morejon | 1 |
4 Yoshinobu Yamamoto | 1 |
5 Freddy Peralta | 1 |
Top 5 Earned Run Average
#Player | ERA |
---|---|
1 Dylan Cease | 0.00 |
2 Adrian Morejon | 0.00 |
3 Tyler Glasnow | 0.00 |
4 Blake Snell | 0.86 |
5 Jacob Misiorowski | 1.29 |
Top 5 Saves
#Player | SV |
---|---|
1 Brad Keller | 2 |
2 Roki Sasaki | 2 |
3 Andrew Kittredge | 1 |
4 Robert Suarez | 1 |
5 Blake Treinen | 1 |
Top 5 Strikeouts
#Player | SO |
---|---|
1 Blake Snell | 28 |
2 Freddy Peralta | 15 |
3 Cristopher Sanchez | 13 |
4 Yoshinobu Yamamoto | 11 |
5 Tyler Glasnow | 10 |
Umpires
Top 5 Umpire Homer
#Name | W/L | % | $ |
---|---|---|---|
1 Lance Barksdale | 1-0 | 100.0 | 106 |
2 Will Little | 1-0 | 100.0 | 97 |
3 D.J. Reyburn | 1-0 | 100.0 | 90 |
4 Mike Estabrook | 1-0 | 100.0 | 78 |
5 Chris Conroy | 1-0 | 100.0 | 77 |
Top 5 Umpire O/U
#Name | O/U | % | AVG |
---|---|---|---|
1 Nick Mahrley | 1-0 | 100.0 | 15.0 |
2 Lance Barrett | 1-0 | 100.0 | 12.0 |
3 Edwin Moscoso | 1-0 | 100.0 | 12.0 |
4 Mike Estabrook | 1-0 | 100.0 | 10.0 |
5 Nic Lentz | 1-0 | 100.0 | 10.0 |
Latest headlines Checkout latest headlinesRead more
Pages Related to This Topic
What are MLB betting stats? π
MLB betting stats offer deep insights into how teams perform not just on the diamond β but in relation to oddsmakersβ expectations. With a 162-game season and daily betting opportunities, knowing how to use metrics like ATS, O/U, and situational splits can be the difference between blind betting and sharp strategy.
Hereβs a breakdown of the key stats on this page and how to use them for more profitable baseball betting.
ATS (Against the Spread / Runline)
What it means: In MLB, ATS typically refers to runline betting β where a team must win by 2+ runs (β1.5) or lose/win by fewer than 2 runs (+1.5).
How to use it: A team like the Rays could be 60-45 ATS, indicating theyβve consistently beaten the runline. Underdogs that win outright or keep games close often offer ATS value.
π Runline stats are essential when deciding whether to bet a favorite straight up or lay the β1.5.
π Use the latest MLB odds to compare runline prices and spot market inefficiencies.
O/U (Over/Under Totals)
What it means: Tracks how often games go Over or Under the posted total runs.
How to use it: Team tendencies β like high-powered lineups or unreliable bullpens β directly influence totals. If the Rockies are 68-40 to the Over, it often signals offensive firepower or Coors Field factor.
π Factor in ballpark effects, pitching matchups, and weather when betting totals.
π Learn more with our MLB betting guide.
SU (Straight-Up)
What it means: Outright win-loss records.
How to use it: Great for evaluating moneyline betting opportunities. Teams might be profitable SU without being elite β especially with plus-money value. For example, the Orioles may be 55-50 SU but +10 units due to frequent underdog wins.
π Use SU stats alongside profit/loss metrics to gauge value beyond win totals.
Home/Away Splits
What it means: Tracks performance based on location.
How to use it: Some teams dominate at home but collapse on the road. If the Padres are 35-20 ATS at home but 20-40 away, location should strongly influence your wager.
π Ballpark familiarity, travel, and lineup depth often shift performance drastically between venues.
Division/League Records
What it means: Shows how teams fare against divisional or league opponents.
How to use it: Divisional matchups are common and often tight. A team with a strong ATS record vs. its division may be particularly effective at exploiting familiar opponents.
π Use this when betting series between rivals or when playoff races heat up late in the season.
How to boost your MLB betting success π
Betting on baseball becomes more rewarding when you pair your insights with the best promo codes. Bonuses can help smooth out cold streaks and capitalize on your winning reads.
βΎ Start with the Best MLB Betting Sites to find top sportsbooks and features.
π Score the latest sportsbook promos to boost your bankroll with welcome offers and ongoing promos.
Baseball is a grind β but with the right stats and bonus strategy, your bets can go the distance.