


| Overall | After Win | After Loss | |
|---|---|---|---|
| Game 1 | 19-17 | 9-7 | 10-10 |
| Game 2 | 19-16 | 7-12 | 12-4 |
| Game 3 | 17-18 | 10-9 | 7-9 |
| Game 4 | 2-2 | 2-1 | 0-1 |
| Overall | After Win | After Loss | |
|---|---|---|---|
| Game 1 | 20-16 | 11-8 | 9-8 |
| Game 2 | 13-22 | 8-11 | 5-11 |
| Game 3 | 19-16 | 6-7 | 13-9 |
| Game 4 | 2-2 | 2-0 | 0-2 |

| Team | R | H | E | 1 | 2 | 3 | 4 | 5 | 6 | 7 | 8 | 9 |
|---|---|---|---|---|---|---|---|---|---|---|---|---|
 PHI
Philadelphia |
5 | 10 | 0 | 0 | 0 | 0 | 0 | 1 | 0 | 0 | 4 | 0 |
 BAL
Baltimore |
0 | 3 | 0 | 0 | 0 | 0 | 0 | 0 | 0 | 0 | 0 | 0 |
Philadelphia Pitcher
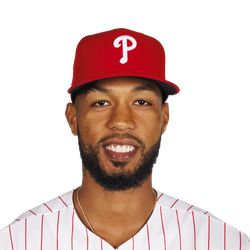 C. Sanchez
(W)
Baltimore Pitcher
 S. Baz
(L)
| Team | ML | O/U (Margin) | ATS (Margin) |
|---|---|---|---|
|
PHI
Philadelphia
|
-154 | 8o | -1.5 (3.5) |
|
BAL
Baltimore
|
+127 | 8u (3) | +1.5 |
| POS | AB | R | H | RBI | BB | SO | LOB | AVG | |
|---|---|---|---|---|---|---|---|---|---|
| T. Turner | SS | 5 | 0 | 2 | 0 | 0 | 0 | 0 | .249 |
| K. Schwarber | DH | 4 | 1 | 0 | 0 | 1 | 3 | 3 | .248 |
| B. Harper | 1B | 4 | 1 | 2 | 0 | 1 | 0 | 1 | .254 |
| A. Bohm | 3B | 5 | 0 | 1 | 1 | 0 | 1 | 3 | .223 |
| B. Marsh | LF | 4 | 1 | 2 | 1 | 0 | 1 | 2 | .279 |
| J. Realmuto | C | 3 | 1 | 0 | 0 | 1 | 1 | 1 | .223 |
| B. Stott | 2B | 3 | 1 | 1 | 0 | 1 | 0 | 4 | .253 |
| J. Crawford | CF | 4 | 0 | 1 | 2 | 0 | 0 | 2 | .257 |
| B. De La Cruz | RF | 4 | 0 | 1 | 1 | 0 | 1 | 3 | .444 |
| D. Hill | RF | 0 | 0 | 0 | 0 | 0 | 0 | 0 | .273 |
| Totals | 36 | 5 | 10 | 5 | 4 | 7 | 19 | ||
Battling
Baserunning
| POS | AB | R | H | RBI | BB | SO | LOB | AVG | |
|---|---|---|---|---|---|---|---|---|---|
| C. Mayo | DH | 3 | 0 | 0 | 0 | 0 | 2 | 0 | .199 |
| D. Beavers | PH -DH | 1 | 0 | 1 | 0 | 0 | 0 | 0 | .247 |
| T. Ward | LF | 3 | 0 | 0 | 0 | 1 | 1 | 1 | .245 |
| G. Henderson | SS | 3 | 0 | 1 | 0 | 1 | 1 | 1 | .220 |
| P. Alonso | 1B | 4 | 0 | 0 | 0 | 0 | 3 | 3 | .249 |
| T. O'Neill | RF | 3 | 0 | 1 | 0 | 1 | 0 | 0 | .209 |
| C. Encarnacion-Strand | 3B | 2 | 0 | 0 | 0 | 2 | 1 | 0 | .306 |
| L. Taveras | CF | 4 | 0 | 0 | 0 | 0 | 1 | 6 | .220 |
| J. Holliday | 2B | 4 | 0 | 0 | 0 | 0 | 3 | 0 | .255 |
| J. Rogers | C | 3 | 0 | 0 | 0 | 0 | 2 | 0 | .000 |
| Totals | 30 | 0 | 3 | 0 | 5 | 14 | 11 | ||
Battling
Baserunning
Fielding
| IP | H | R | ER | BB | SO | HR | ERA | |
|---|---|---|---|---|---|---|---|---|
| C. Sanchez (W 14-4) | 6 .0 | 2 | 0 | 0 | 5 | 11 | 0 | 2.61 |
| J. Bowlan (H 7) | 1 .0 | 1 | 0 | 0 | 0 | 3 | 0 | 3.03 |
| J. Alvarado | 1 .0 | 0 | 0 | 0 | 0 | 0 | 0 | 5.71 |
| J. Duran | 1 .0 | 0 | 0 | 0 | 0 | 0 | 0 | 1.98 |
| IP | H | R | ER | BB | SO | HR | ERA | |
|---|---|---|---|---|---|---|---|---|
| S. Baz (L 4-10) | 6 .1 | 6 | 1 | 1 | 1 | 4 | 0 | 3.86 |
| R. Garcia | 0 .2 | 0 | 0 | 0 | 0 | 0 | 0 | 3.04 |
| G. Wolfram | 0 .1 | 0 | 2 | 2 | 2 | 0 | 0 | 4.59 |
| A. Kittredge | 0 .1 | 3 | 2 | 2 | 1 | 0 | 0 | 4.02 |
| Y. Hiraldo | 1 .1 | 1 | 0 | 0 | 0 | 3 | 0 | 12.00 |
Location Oriole Park at Camden Yards
Temperature 79° Temperature
Attendance 37,751 attendance
Home Marvin Hudson
1st Tripp Gibson
2nd Nick Mahrley
3rd Derek Thomas
| Date | Home | Result | ML | O/U | PHI Starter (IP) | BAL Starter (IP) |
|---|---|---|---|---|---|---|
| Jul 31, '26 | BAL |
6 - 4
|
BAL -112 | o9.0 | A. Painter (6.0) | B. Young (5.2) |
| Aug 06, '25 | PHI |
5 - 1
|
BAL +155 | u7.5 | R. Suarez (6.1) | T. Rogers (6.0) |
| Aug 05, '25 | PHI |
5 - 0
|
PHI -128 | u10.0 | T. Walker (6.0) | D. Kremer (6.0) |
| Aug 04, '25 | PHI |
13 - 3
|
PHI -188 | o9.0 | J. Luzardo (6.0) | C. Povich (5.2) |
| Jun 16, '24 | BAL |
8 - 3
|
BAL -134 | o7.0 | Z. Wheeler (4.1) | C. Burnes (6.0) |
| Jun 15, '24 | BAL |
6 - 2
|
BAL -175 | P8.0 | T. Walker (5.2) | G. Rodriguez (7.0) |
| Jun 14, '24 | BAL |
5 - 3
|
PHI +123 | o7.0 | R. Suarez (6.2) | K. Bradish (5.0) |
| Jul 26, '23 | PHI |
6 - 4
|
PHI -110 | o9.0 | R. Suarez (6.0) | K. Bradish (6.2) |
| Jul 25, '23 | PHI |
4 - 3
|
PHI -117 | u9.5 | T. Walker (5.2) | K. Gibson (6.0) |
| Jul 24, '23 | PHI |
3 - 2
|
BAL +108 | u9.5 | C. Sanchez (7.0) | D. Kremer (7.0) |
Last Meeting ( Jul 31, 2026 ) Philadelphia 4, Baltimore 6
The Baltimore Orioles have found enough ways to stay in the chase for an American League wild card. The recent formula has come in the form of comebacks this week.
"I feel like we showed that we can come back all year," manager Craig Albernaz said. "Like we've had some chances and shots that we've scratched and clawed to come back."
The Orioles will look to get it done again Saturday night regardless of how the script plays out when they meet the visiting Philadelphia Phillies in the middle game of a three-game series.
Baltimore is looking for its second three-game winning streak since the All-Star break.
"There are obviously a couple games where we kind of shot ourselves in the foot," shortstop Gunnar Henderson said. "But overall, I feel like we played better baseball and there's still, obviously, a lot more room for improvement, but I felt like we started to get back to where we are and trending in the right direction."
The Phillies have lost eight of their last nine games after falling 6-4 in Friday night's meeting. They were undone by the Orioles' four-run seventh inning.
"It feels different to me," Phillies interim manager Don Mattingly said. "I think early (in the season) when it's snowballing, it's a lot easier to go ‘we're going to be fine,' I think now it will be a little bit more sense of urgency where we're at."
Shortstop Trea Turner had half of Philadelphia's six hits, including a home run, in the series opener.
Henderson had only one RBI for Baltimore across a nine-game stretch prior to his go-ahead, two-run triple in Friday's seventh inning.
"It was big for Gunnar, big for us," Albernaz said. "But big for Gunnar just because, I mean, the standards are high for Gunnar in his eyes and to come through like that for us was huge."
The Phillies look to starting pitcher Cristopher Sanchez (13-4, 2.73 ERA), a left-hander, to launch a turnaround of the team's fortunes. He'll be looking for a victory in his fourth consecutive start.
Sanchez was a bit erratic during Sunday night's six-inning effort in defeating the visiting New York Yankees, giving up three runs and handing out three walks - the most he had issued in a game since April.
Five of Sanchez's victories this year have come against American League teams. He has faced Baltimore only once, going without a decision while giving up two runs in seven innings in a July 2023 meeting.
The Orioles send right-hander Shane Baz (4-9, 3.98 ERA) to the mound searching for his first victory since June 12. He hasn't reached the five-inning mark in two of his last three starts.
Baz's control has improved because in July he issued five walks and struck out 20 batters in 21 innings. In his career, he has made two starts vs. the Phillies, going 0-1 with an 8.31 ERA across 8 2/3 innings.
Baz could be throwing to a Baltimore newcomer after the Orioles acquired catcher Jake Rogers from the Detroit Tigers. He made his debut with the Orioles as a defensive replacement in the eighth inning Friday.
"The intangibles jump off, like great teammate, everything we've heard about him," Albernaz said. "So he'll fit in nicely with us."
-Field Level Media
Philadelphia's Injuries| Player | POS | Status | Date | Note |
|---|---|---|---|---|
| J. Bowlan | RP | Day To Day - Groin( Sep 26, '26) | Sep 26, '26 | |
| Bowlan is not in the starting line up in Sunday's (Sep. 27) game against the Rays due to a mild right groin strain. | ||||
| F. Reyes | LF | Sixty Day IL - Wrist( Aug 19, '26) | Aug 19, '26 | |
| The Philadelphia Phillies placed OF Felix Reyes on the 60-day injured list with a right wrist fracture. | ||||
| C. Kilian | RP | Sixty Day IL - Oblique( Aug 09, '26) | Aug 09, '26 | |
| The Philadelphia Phillies placed RP Caleb Kilian on the 60-day injured list due to left oblique strain. | ||||
| B. Keller | RP | Sixty Day IL - Elbow( Jul 23, '26) | Jul 23, '26 | |
| The Philadelphia Phillies transferred RHP Brad Keller to the 60-day injured list with a right elbow UCL tear. | ||||
| J. Rojas | CF | Sixty Day IL - Elbow( Jun 24, '26) | Jun 24, '26 | |
| The Philadelphia Phillies placed OF Johan Rojas on the 60-day injured list with a right elbow UCL repair. | ||||
| A. Garcia | RF | Sixty Day IL - Lat( Jun 09, '26) | Jun 09, '26 | |
| The Philadelphia Phillies placed OF Adolis García on the 60-day injured list with a right latissimus dorsi tear. | ||||
Baltimore's Injuries| Player | POS | Status | Date | Note |
|---|---|---|---|---|
| K. Bradish | SP | Sixty Day IL - Lower Abdominal( Sep 23, '26) | Sep 23, '26 | |
| The Baltimore Orioles placed SP Kyle Bradish on the 60-day injured list due to lower abdominal discomfort. | ||||
| S. Basallo | C | Seven Day IL - Concussion( Sep 22, '26) | Sep 22, '26 | |
| The Baltimore Orioles placed Samuel Basallo (C) on the 7-day injured list due to Concussion. | ||||
| T. O'Neill | RF | Sixty Day IL - Shoulder( Sep 18, '26) | Sep 18, '26 | |
| The Baltimore Orioles transferred RF Tyler O'Neill to the 60-day injured list. | ||||
| J. Holliday | 2B | Ten Day IL - Wrist( Sep 15, '26) | Sep 15, '26 | |
| The Baltimore Orioles placed Jackson Holliday (2B) on the 10-day injured list due to left wrist inflammation. | ||||
| B. Alexander | 3B | Ten Day IL - Back( Sep 08, '26) | Sep 08, '26 | |
| The Baltimore Orioles placed Blaze Alexander (3B) on the 10-day injured list with a low back discomfort. | ||||
| L. Robert Jr. | CF | Ten Day IL - Hamstring( Sep 05, '26) | Sep 05, '26 | |
| The Baltimore Orioles placed Luis Robert (CF) on the 10-day injured list due to left hamstring discomfort. | ||||
| R. Mountcastle | 1B | Sixty Day IL - Foot( Jul 30, '26) | Jul 30, '26 | |
| The Baltimore Orioles said on Friday (Jul. 31) that INF Ryan Mountcastle pulled an oblique earlier this week and will now miss a couple more months. | ||||
| K. Akin | RP | Sixty Day IL - Elbow( Jul 12, '26) | Jul 12, '26 | |
| The Baltimore Orioles transferred LHP Keegan Akin from the 15-day injured list to the 60-day injured list due to left elbow discomfort. | ||||
| R. Helsley | RP | Sixty Day IL - Elbow( Jul 02, '26) | Jul 02, '26 | |
| The Baltimore Orioles transferred RHP Ryan Helsley to the 60-day injured list. | ||||
| Z. Eflin | SP | Sixty Day IL - Elbow( Apr 06, '26) | Apr 06, '26 | |
| The Baltimore Orioles transferred RHP Zach Eflin from the 15-day injured list to the 60-day injured list with right elbow discomfort. | ||||
| J. Westburg | 3B | Sixty Day IL - UCL( Mar 31, '26) | Mar 31, '26 | |
| Westburg will miss the remainder of the 2026 season according to Andy Kostka of The Baltimore Banner. | ||||
| C. Selby | SP | Sixty Day IL - Shoulder( Feb 13, '26) | Feb 13, '26 | |
| The Baltimore Orioles placed RHP Colin Selby on the 60-day injured list due to right shoulder inflammation. | ||||
2026
Jersey Number 0
Games Officiated 23
Home Team W/L 14-9
Home Avg. Margin 0.26
Home Money Total 122
| Umpire | G | W-L | AVG | PIT | STR | B | STR% | STR | BB | K/BB | HR | O/U |
|---|---|---|---|---|---|---|---|---|---|---|---|---|
| Marvin Hudson | 23 | 14-9 | 6.43 | 285.26 | 181.78 | 103.48 | 63.7 | 17.2 | 6.3 | 2.74 | 1.74 | 3-18 |
Game Stats | |
|---|---|
| Average | 6.43 |
| Starters Runs | 3.87 |
| BullPens Runs | 2.57 |
| Pitches | 285.3 |
| Strikes | 181.8 |
| Balls | 103.5 |
| Strike% | 63.73 % |
| SO | 17.2 |
| Walks | 6.3 |
| SO/Walks | 2.74 |
| HR | 1.7 |
Home Favourite |
Home Underdog |
||
|---|---|---|---|
| -101 to -120 | 3 - 3 | 100 to 110 | 0 - 1 |
| -121 to -140 | 3 - 2 | 111 to 130 | 0 - 1 |
| -141 to -160 | 1 - 1 | 131 to 150 | 1 - 0 |
| -161 to -180 | 3 - 1 | 151 to 170 | 0 - 0 |
| -181 + | 3 - 0 | 171 + | 0 - 0 |
Total |
Over | Under |
|---|---|---|
| 7 or less | 0 | 1 |
| 7.5 | 3 | 2 |
| 8 | 0 | 4 |
| 8.5 | 0 | 3 |
| 9 | 0 | 3 |
| 9.5 | 0 | 3 |
| 10 | 0 | 0 |
| 10.5 | 0 | 2 |
| 11 | 0 | 0 |
| 11.5 | 0 | 0 |
| 12 | 0 | 0 |
| 12.5 | 0 | 0 |
| 13+ | 0 | 0 |
| Date | Score | Line | O/U | Road Starter | Home Starter |
|---|---|---|---|---|---|
| Jul 28, 2026 | MIN 3 - KC 2 | W -180 | U 9.0 | Seth Lugo (R) | Taj Bradley (R) |
| Jul 24, 2026 | TEX 5 - SEA 4 | W -102 | O 7.5 | Bryce Miller (R) | MacKenzie Gore (L) |
| Jul 19, 2026 | MIL 3 - MIA 1 | W -130 | U 8.0 | Eury Perez (R) | Robert Gasser (L) |
| Jul 11, 2026 | BAL 6 - KC 1 | W -158 | U 9.0 | Noah Cameron (L) | Kyle Bradish (R) |
| Jul 7, 2026 | MIN 3 - CLE 1 | W -110 | U 8.5 | Joey Cantillo (L) | Taj Bradley (R) |
| Jun 4, 2026 | BOS 2 - BAL 8 | L -116 | U 10.5 | Trevor Rogers (L) | Brayan Bello (R) |
| May 30, 2026 | CIN 2 - ATL 5 | L +110 | U 9.5 | Martin Perez (L) | Brady Singer (R) |
| May 25, 2026 | MIL 5 - STL 1 | W -220 | U 7.5 | Matthew Liberatore (L) | Jacob Misiorowski (R) |
| May 18, 2026 | MIN 6 - HOU 3 | W -110 | U 9.5 | Tatsuya Imai (R) | Kendry Rojas (L) |
| May 14, 2026 | LAD 5 - SF 2 | W -172 | U 7.5 | Landen Roupp (R) | Emmet Sheehan (R) |
| Date | Score | Line | O/U | Road Starter | Home Starter |
|---|---|---|---|---|---|
| Mar 31, 2026 | PHI 3 - WAS 2 | W -188 | U 9.5 | PJ Poulin (L) | Andrew Painter (R) |
| Date | Score | Line | O/U | Road Starter | Home Starter |
|---|---|---|---|---|---|
| Jul 11, 2026 | BAL 6 - KC 1 | W -158 | U 9.0 | Noah Cameron (L) | Kyle Bradish (R) |
| Jun 4, 2026 | BOS 2 - BAL 8 | L -116 | U 10.5 | Trevor Rogers (L) | Brayan Bello (R) |
| Date | Score | Line | O/U | Road Starter | Home Starter |
|---|
| Date | Score | Line | O/U | Road Starter | Home Starter |
|---|
Cristopher Sanchez (L)
Last 5
|
Date
Score
|
Line | O/U | IP | H | R | ER | SO | BB | HR | PIT | P/IP | GB:FB |
|---|---|---|---|---|---|---|---|---|---|---|---|---|
|
Jul 26, '26
PHI 11 - NYY 4
|
W -210 | o8.0 | 6.0 | 6 | 3 | 3 | 6 | 3 | 0 | 101 | 16.8 | 10.0 |
|
Jul 20, '26
PHI 10 - LAD 7
|
W -144 | o8.5 | 5.1 | 7 | 3 | 2 | 7 | 0 | 0 | 99 | 18.6 | 7.0 |
|
Jul 11, '26
DET 2 - PHI 4
|
W -142 | u8.0 | 7.0 | 10 | 2 | 2 | 7 | 1 | 1 | 103 | 14.7 | 1.0 |
|
Jul 06, '26
KC 15 - PHI 1
|
L -210 | o8.5 | 3.1 | 12 | 9 | 9 | 1 | 1 | 3 | 83 | 24.9 | 2.5 |
|
Jun 30, '26
PHI 8 - PIT 0
|
W -220 | u8.5 | 7.0 | 3 | 0 | 0 | 9 | 2 | 0 | 92 | 13.1 | 3.5 |
| Last 5 Avg. | 5.2 | 7.6 | 3.4 | 3.2 | 6.0 | 1.4 | 0.8 | 95.6 | 17.6 | 4.8 |
|
Date
Score
|
Line | O/U | IP | H | R | ER | SO | BB | HR | PIT | P/IP | GB:FB |
|---|---|---|---|---|---|---|---|---|---|---|---|---|
|
Jul 24, '23
PHI 2 - BAL 3
|
L -116 | u9.5 | 7.0 | 4 | 2 | 2 | 8 | 0 | 2 | 92 | 13.1 | 3.0 |
| Last 1 Avg. | 7.0 | 4.0 | 2.0 | 2.0 | 8.0 | 0.0 | 2.0 | 92.0 | 13.1 | 3.0 |
Shane Baz (R)
Last 5
|
Date
Score
|
Line | O/U | IP | H | R | ER | SO | BB | HR | PIT | P/IP | GB:FB |
|---|---|---|---|---|---|---|---|---|---|---|---|---|
|
Jul 26, '26
BAL 2 - ATL 3
|
L -106 | u8.5 | 4.1 | 6 | 2 | 1 | 2 | 2 | 0 | 90 | 20.8 | 1.7 |
|
Jul 20, '26
BOS 6 - BAL 5
|
L +138 | o8.5 | 6.0 | 6 | 4 | 1 | 6 | 0 | 0 | 77 | 12.8 | 2.0 |
|
Jul 12, '26
BAL 8 - KC 2
|
W -148 | o9.5 | 4.2 | 8 | 2 | 2 | 9 | 0 | 0 | 104 | 22.3 | 1.0 |
|
Jul 07, '26
BAL 2 - CHC 5
|
L -104 | u9.5 | 6.0 | 6 | 3 | 3 | 3 | 3 | 0 | 100 | 16.7 | 1.3 |
|
Jun 29, '26
BAL 2 - CHW 8
|
L -136 | o9.5 | 7.0 | 4 | 2 | 2 | 6 | 4 | 0 | 109 | 15.6 | 0.6 |
| Last 5 Avg. | 5.1 | 6.0 | 2.6 | 1.8 | 5.2 | 1.8 | 0.0 | 96.0 | 17.6 | 1.3 |
|
Date
Score
|
Line | O/U | IP | H | R | ER | SO | BB | HR | PIT | P/IP | GB:FB |
|---|---|---|---|---|---|---|---|---|---|---|---|---|
|
May 07, '25
TB 0 - PHI 7
|
L +149 | u8.5 | 3.1 | 8 | 6 | 6 | 3 | 2 | 1 | 83 | 24.9 | 6.0 |
|
Sep 11, '24
PHI 3 - TB 2
|
L +196 | u7.0 | 5.1 | 3 | 2 | 2 | 4 | 1 | 1 | 78 | 14.6 | 3.5 |
| Last 2 Avg. | 4.1 | 5.5 | 4.0 | 4.0 | 3.5 | 1.5 | 1.0 | 80.5 | 19.8 | 4.8 |
| Team | ERA | AVG. | OBP | WHIP | IP | HR | BB | K |
|---|---|---|---|---|---|---|---|---|
|
Philadelphia
|
4.28 | .254 | .318 | 1.31 | 8.2 | 1.2 | 2.9 | 9.7 |
|
Baltimore
|
4.21 | .254 | .320 | 1.33 | 8.2 | 1.1 | 3.3 | 7.9 |
| Team | Runs/9 | ERA | AVG. | OBP | WHIP | IP | HR | BB | K |
|---|---|---|---|---|---|---|---|---|---|
|
Philadelphia
|
4.39 | 4.16 | .256 | .314 | 1.29 | 5.0 | 0.8 | 1.6 | 5.8 |
|
Baltimore
|
4.87 | 4.38 | .265 | .332 | 1.39 | 5.0 | 0.7 | 2.0 | 4.6 |
| Team | Runs/9 | ERA | AVG. | OBP | WHIP | IP | HR | BB | K |
|---|---|---|---|---|---|---|---|---|---|
|
Philadelphia
|
4.84 | 4.47 | .251 | .325 | 1.33 | 3.1 | 0.4 | 1.3 | 3.9 |
|
Baltimore
|
4.80 | 3.96 | .236 | .301 | 1.24 | 3.1 | 0.4 | 1.2 | 3.3 |


