


| Overall | After Win | After Loss | |
|---|---|---|---|
| Game 1 | 29-21 | 14-8 | 15-13 |
| Game 2 | 29-20 | 16-12 | 13-8 |
| Game 3 | 20-28 | 16-13 | 4-15 |
| Game 4 | 6-1 | 4-0 | 2-1 |
| Overall | After Win | After Loss | |
|---|---|---|---|
| Game 1 | 31-19 | 18-11 | 13-8 |
| Game 2 | 29-20 | 21-10 | 8-10 |
| Game 3 | 31-17 | 21-8 | 10-9 |
| Game 4 | 2-4 | 1-3 | 1-1 |

| Team | R | H | E | 1 | 2 | 3 | 4 | 5 | 6 | 7 | 8 | 9 |
|---|---|---|---|---|---|---|---|---|---|---|---|---|
 BOS
Boston |
1 | 8 | 2 | 0 | 0 | 1 | 0 | 0 | 0 | 0 | 0 | 0 |
 TB
Tampa Bay |
2 | 8 | 0 | 0 | 0 | 0 | 1 | 0 | 0 | 0 | 0 | 1 |
Boston Pitcher
 G. Whitlock
(L)
Tampa Bay Pitcher
 B. Baker
(W)
| Team | ML | O/U (Margin) | ATS (Margin) |
|---|---|---|---|
|
BOS
Boston
|
+130 | 7.5o | +1.5 (0.5) |
|
TB
Tampa Bay
|
-157 | 7.5u (4.5) | -1.5 |
| POS | AB | R | H | RBI | BB | SO | LOB | AVG | |
|---|---|---|---|---|---|---|---|---|---|
| R. Anthony | LF | 4 | 0 | 1 | 1 | 0 | 1 | 1 | .236 |
| M. Gasper | DH | 4 | 0 | 0 | 0 | 0 | 2 | 2 | .260 |
| A. Rutschman | C | 4 | 0 | 1 | 0 | 0 | 1 | 0 | .189 |
| N. Eaton | PR | 0 | 0 | 0 | 0 | 0 | 0 | 0 | .140 |
| C. Wong | C | 0 | 0 | 0 | 0 | 0 | 0 | 0 | .234 |
| W. Abreu | RF | 2 | 0 | 0 | 0 | 2 | 2 | 1 | .251 |
| N. Sogard | 1B | 4 | 0 | 1 | 0 | 0 | 1 | 2 | .255 |
| T. Story | SS | 4 | 0 | 1 | 0 | 0 | 1 | 2 | .247 |
| C. Durbin | 3B | 4 | 1 | 2 | 0 | 0 | 0 | 4 | .253 |
| J. Duran | CF | 3 | 0 | 2 | 0 | 0 | 0 | 0 | .206 |
| I. Kiner-Falefa | 2B | 3 | 0 | 0 | 0 | 0 | 1 | 2 | .252 |
| Totals | 32 | 1 | 8 | 1 | 2 | 9 | 14 | ||
Battling
Baserunning
Fielding
| POS | AB | R | H | RBI | BB | SO | LOB | AVG | |
|---|---|---|---|---|---|---|---|---|---|
| J. Fraley | DH | 4 | 0 | 0 | 0 | 0 | 2 | 0 | .216 |
| J. Aranda | 1B | 4 | 1 | 1 | 1 | 0 | 2 | 0 | .277 |
| J. Caminero | 3B | 4 | 1 | 1 | 0 | 0 | 1 | 0 | .277 |
| L. Hicks | C | 3 | 0 | 2 | 0 | 0 | 0 | 0 | .305 |
| J. DeLuca | PR -CF | 1 | 0 | 0 | 0 | 0 | 0 | 1 | .259 |
| C. Simpson | LF | 4 | 0 | 2 | 0 | 0 | 0 | 1 | .309 |
| V. Mesa Jr. | RF | 4 | 0 | 0 | 0 | 0 | 3 | 6 | .249 |
| R. Palacios | 2B | 4 | 0 | 1 | 1 | 0 | 1 | 3 | .234 |
| C. Mullins | CF | 3 | 0 | 1 | 0 | 0 | 1 | 2 | .202 |
| N. Fortes | C | 0 | 0 | 0 | 0 | 0 | 0 | 0 | .267 |
| J. Mateo | SS | 2 | 0 | 0 | 0 | 0 | 2 | 0 | .141 |
| T. Walls | PH -SS | 1 | 0 | 0 | 0 | 0 | 0 | 0 | .218 |
| Totals | 34 | 2 | 8 | 2 | 0 | 12 | 13 | ||
Battling
Baserunning
| IP | H | R | ER | BB | SO | HR | ERA | |
|---|---|---|---|---|---|---|---|---|
| B. Bello | 8 .0 | 5 | 1 | 1 | 0 | 11 | 1 | 4.49 |
| G. Whitlock (L 7-2) | 0 .2 | 3 | 1 | 0 | 0 | 1 | 0 | 1.75 |
| IP | H | R | ER | BB | SO | HR | ERA | |
|---|---|---|---|---|---|---|---|---|
| F. Peralta | 5 .2 | 4 | 1 | 1 | 2 | 6 | 0 | 3.60 |
| K. Kelly | 1 .0 | 1 | 0 | 0 | 0 | 1 | 0 | 2.50 |
| C. Booser | 0 .1 | 0 | 0 | 0 | 0 | 0 | 0 | 2.11 |
| C. Sulser | 1 .0 | 1 | 0 | 0 | 0 | 2 | 0 | 4.47 |
| B. Baker (W 4-2) | 1 .0 | 2 | 0 | 0 | 0 | 0 | 0 | 1.49 |
Location Tropicana Field
Temperature 87° Temperature
Attendance 27,402 attendance
Home Jeremie Rehak
1st Adam Beck
2nd Dan Iassogna
3rd Brock Ballou
| Date | Home | Result | ML | O/U | BOS Starter (IP) | TB Starter (IP) |
|---|---|---|---|---|---|---|
| Sep 18, '26 | TB |
4 - 2
|
BOS +114 | u7.0 | R. Suarez (5.2) | I. Seymour (5.0) |
| Jul 19, '26 | BOS |
6 - 1
|
BOS -126 | u8.5 | S. Gray (6.0) | S. McClanahan (5.0) |
| Jul 18, '26 | BOS |
7 - 6
|
BOS -110 | o9.5 | P. Sandoval (5.0) | I. Seymour (3.0) |
| Jul 17, '26 | BOS |
5 - 3
|
BOS -126 | u8.5 | E. Rivera (2.1) | M. Englert (5.0) |
| Jul 17, '26 | BOS |
10 - 0
|
BOS -118 | o8.5 | J. Bennett (6.0) | G. Jax (5.0) |
| Jun 10, '26 | TB |
7 - 5
|
TB -162 | o6.5 | J. Bennett (5.0) | D. Rasmussen (7.0) |
| Jun 09, '26 | TB |
4 - 3
|
TB +104 | u7.5 | P. Tolle (6.0) | N. Martinez (7.0) |
| Jun 08, '26 | TB |
3 - 1
|
TB -102 | u8.0 | C. Early (4.2) | I. Seymour (4.0) |
| May 10, '26 | BOS |
4 - 1
|
-- | -- | P. Tolle (5.0) | N. Martinez (5.2) |
| May 08, '26 | BOS |
2 - 0
|
BOS -132 | u8.5 | C. Early (7.0) | J. Scholtens (4.2) |
Last Meeting ( Sep 18, 2026 ) Boston 4, Tampa Bay 2
Boston Red Sox interim manager Chad Tracy knows his team has figured out the Tampa Bay Rays pretty well this season.
That said, the Red Sox (84-70) still can learn more about the Rays (93-60) when the teams meet Saturday afternoon in St. Petersburg, Fla.
"At this point with (the Rays), we've played them enough already," Tracy said. "We have a pretty good understanding of them, (and) they have a pretty good understanding of us. But you could always pick up more stuff."
In Friday's series opener, the Red Sox scored four runs over the first three innings and won 4-2 to snap Tampa Bay's six-game winning streak and improve to 6-5 this season vs. the Rays.
Boston currently holds the second wild-card position in the American League but is dealing with several injuries.
"We have guys beat up that aren't here, and the hope is we get people healthy, and the roster could look even different a week from now than it does right now," Tracy said.
Boston's Willson Contreras is day-to-day after getting hit on the hand, while closer Aroldis Chapman (lat tightness) has been unavailable the past two contests.
Right-hander Tanner Houck (Tommy John surgery in 2025) and lefty Garrett Crochet (left shoulder inflammation) have advanced in their rehab assignments.
Boston left-hander Payton Tolle (9-6, 3.02 ERA) is expected to make his 26th start on Saturday and will try to record his sixth consecutive win.
Tolle is 1-0 with an 0.75 ERA over 12 innings in his last two starts, allowing one run on eight hits while striking out 19 with a walk. He is 0-2 with a 4.50 ERA in two starts and one relief outing against Tampa Bay, which already has clinched a playoff berth.
Whatever Rays pitching coach Kyle Snyder and the rest of the staff have done with trade-deadline acquisition Freddy Peralta certainly has been a success.
Acquired by the club from the New York Mets for three prospects on Aug. 2, Peralta (9-11, 4.67 ERA) -- a right-hander who will start for the Rays on Saturday -- arrived from the Big Apple as a lesser version of what he was during his two All-Star seasons with the Milwaukee Brewers.
He was 5-9 with a 4.99 ERA with the Mets, but the work was immediately put in by the Rays to adjust Peralta to where he was when he was a 17-game winner with a sub-3.00 ERA last season.
"For some reason, when I got here, when I sat here with Kyle and (bullpen coach Jorge Moncada) and (manager Kevin Cash), they told me, like, ‘You're gonna do what you want to do here, and we are going to help you to do it,'" Peralta said.
"And we know what you need to do to make those adjustments. We just put everything on the table. I just followed all the instructions, and it's what I am right now."
With the Rays, Peralta is 4-2 with a 3.86 ERA in eight starts, but his past four outings have been gems. He has pitched 23 innings and has allowed just two runs on 10 hits, with 17 strikeouts, four walks and an 0.78 ERA in that span.
"Fastball Freddy," who is using his changeup much more with the Rays, is 0-2 with a 5.40 ERA in three career starts against Boston.
Peralta allowed two runs on three hits in 4 1/3 innings in a 4-0 loss at Boston on July 11 while with the Mets.
--Field Level Media
Boston's Injuries| Player | POS | Status | Date | Note |
|---|---|---|---|---|
| J. Slaten | RP | Sixty Day IL - Elbow( Sep 28, '26) | Sep 28, '26 | |
| The Boston Red Sox transferred RHP Justin Slaten from the 15-day injured list to the 60-day injured list due to right elbow inflammation. | ||||
| M. Gasper | DH | Ten Day IL - Biceps( Sep 26, '26) | Sep 26, '26 | |
| The Boston Red Sox placed DH Mickey Gasper on the 10-day injured list due to a right biceps strain. | ||||
| T. Guerrero | RP | Fifteen Day IL - Shoulder( Sep 26, '26) | Sep 26, '26 | |
| The Boston Red Sox placed RP Tyron Guerrero on the 15-day injured list due to a right shoulder strain. | ||||
| E. White | CF | Sixty Day IL - Foot( Sep 26, '26) | Sep 26, '26 | |
| The Boston Red Sox placed CF Eli White on the 60-day injured list with a right foot ligament injury. | ||||
| A. Seigler | 2B | Ten Day IL - Wrist( Sep 12, '26) | Sep 12, '26 | |
| The Boston Red Sox placed Anthony Seigler (2B) on the 10-day injured list due to right wrist inflammation. | ||||
| E. Rivera | SP | Sixty Day IL - Back( Aug 31, '26) | Aug 31, '26 | |
| The Boston Red Sox placed LHP Eduardo Rivera on the 60-day injured list with a lumbar strain. | ||||
| M. Yoshida | DH | Ten Day IL - Hamstring( Aug 15, '26) | Aug 15, '26 | |
| The Boston Red Sox placed DH Masataka Yoshida on the 10-day injured list due to a hamstring injury. | ||||
| C. Mead | 3B | Ten Day IL - Hand( Jul 28, '26) | Jul 28, '26 | |
| The Boston Red Sox placed INF Curtis Mead on the 10-day injured list due to left wrist fracture. | ||||
| Z. Kelly | RP | Sixty Day IL - Elbow( Jul 20, '26) | Jul 20, '26 | |
| The Boston Red Sox placed RHP Zack Kelly on the 60-day injured list with right elbow inflammation. | ||||
| K. Crawford | SP | Sixty Day IL - Wrist( May 21, '26) | May 21, '26 | |
| The Boston Red Sox transferred RHP Kutter Crawford from the 15-day injured list to the 60-day injured list as he recovers from right wrist surgery. | ||||
| T. Casas | 1B | Sixty Day IL - Knee( Apr 21, '26) | Apr 21, '26 | |
| The Boston Red Sox transferred INF Triston Casas from the 10-day injured list to the 60-day injured list as he recovers from left patellar tendon repair. | ||||
| J. Oviedo | SP | Sixty Day IL - Elbow( Apr 13, '26) | Apr 13, '26 | |
| The Boston Red Sox transferred RHP Johan Oviedo to the 60-day injured list due to a right elbow strain. | ||||
Tampa Bay's Injuries| Player | POS | Status | Date | Note |
|---|---|---|---|---|
| G. Jax | SP | Day To Day - Back( Sep 26, '26) | Sep 26, '26 | |
| Jax is not in the starting lineup for Sunday's (Sep. 27) game against the Phillies. | ||||
| C. Simpson | LF | Day To Day - Foot( Sep 26, '26) | Sep 26, '26 | |
| Simpson is not in the starting lineup for Sunday's (Sep. 27) game against the Phillies. | ||||
| T. Wells | RP | Fifteen Day IL - Forearm( Sep 14, '26) | Sep 14, '26 | |
| The Tampa Bay Rays placed Tyler Wells (RP) on the 15-day injured list with right forearm tightness. | ||||
| J. Melton | LF | Sixty Day IL - Hamstring( Sep 14, '26) | Sep 14, '26 | |
| The Tampa Bay Rays placed LF Jacob Melton on the 60-day injured list with a right hamstring strain. | ||||
| G. Cleavinger | RP | Fifteen Day IL - Forearm( Sep 04, '26) | Sep 04, '26 | |
| The Tampa Bay Rays placed Garrett Cleavinger (RP) on the 15-day injured list due to left forearm tightness. | ||||
| S. McClanahan | SP | Fifteen Day IL - Forearm( Sep 03, '26) | Sep 03, '26 | |
| The Tampa Bay Rays placed SP Shane McClanahan on the 15-day injured list with left forearm tightness. | ||||
| J. Heasley | RP | Sixty Day IL - Elbow( Jun 07, '26) | Jun 07, '26 | |
| The Tampa Bay Rays transferred RHP Jonathan Heasley from the 15-day injured list to the 60-day injured list due to a right elbow stress reaction. | ||||
| G. Lux | LF | Sixty Day IL - Shoulder( May 26, '26) | May 26, '26 | |
| The Tampa Bay Rays transferred OF Gavin Lux from the 10-day injured list to the 60-day injured list with a right shoulder impingement. | ||||
| R. Pepiot | SP | Sixty Day IL - Hip( Apr 30, '26) | Apr 30, '26 | |
| Pepiot will miss the remainder of the season after undergoing hip surgery according to Marc Topkin of the Tampa Bay Times. | ||||
| E. Uceta | RP | Sixty Day IL - Shoulder( Apr 23, '26) | Apr 23, '26 | |
| The Tampa Bay Rays transferred RHP Edwin Uceta to the 60-day injured list with right shoulder impingement. | ||||
2026
Jersey Number 0
Games Officiated 24
Home Team W/L 15-9
Home Avg. Margin 0.21
Home Money Total 281
| Umpire | G | W-L | AVG | PIT | STR | B | STR% | STR | BB | K/BB | HR | O/U |
|---|---|---|---|---|---|---|---|---|---|---|---|---|
| Jeremie Rehak | 24 | 15-9 | 9.88 | 298.42 | 190.75 | 107.67 | 63.9 | 16.4 | 5.7 | 2.88 | 3.13 | 16-8 |
Game Stats | |
|---|---|
| Average | 9.88 |
| Starters Runs | 5.42 |
| BullPens Runs | 4.46 |
| Pitches | 298.4 |
| Strikes | 190.8 |
| Balls | 107.7 |
| Strike% | 63.92 % |
| SO | 16.4 |
| Walks | 5.7 |
| SO/Walks | 2.88 |
| HR | 3.1 |
Home Favourite |
Home Underdog |
||
|---|---|---|---|
| -101 to -120 | 2 - 0 | 100 to 110 | 1 - 1 |
| -121 to -140 | 5 - 1 | 111 to 130 | 1 - 0 |
| -141 to -160 | 3 - 2 | 131 to 150 | 1 - 1 |
| -161 to -180 | 0 - 1 | 151 to 170 | 0 - 0 |
| -181 + | 2 - 2 | 171 + | 0 - 1 |
Total |
Over | Under |
|---|---|---|
| 7 or less | 1 | 0 |
| 7.5 | 4 | 3 |
| 8 | 3 | 1 |
| 8.5 | 2 | 2 |
| 9 | 3 | 0 |
| 9.5 | 1 | 2 |
| 10 | 1 | 0 |
| 10.5 | 0 | 0 |
| 11 | 0 | 0 |
| 11.5 | 1 | 0 |
| 12 | 0 | 0 |
| 12.5 | 0 | 0 |
| 13+ | 0 | 0 |
| Date | Score | Line | O/U | Road Starter | Home Starter |
|---|---|---|---|---|---|
| Sep 14, 2026 | TOR 5 - DET 6 | L -149 | O 7.5 | Troy Melton (R) | Jose Soriano (R) |
| Sep 10, 2026 | PHI 1 - HOU 2 | L -194 | U 8.5 | Cristian Javier (R) | Zack Wheeler (R) |
| Sep 5, 2026 | NYM 5 - SF 9 | L -171 | O 7.5 | Anthony Molina (R) | Zac Thornton (L) |
| Aug 31, 2026 | MIN 11 - DET 1 | W -122 | O 9.0 | Jackson Jobe (R) | Taj Bradley (R) |
| Aug 2, 2026 | ATH 0 - DET 11 | L +105 | O 10.0 | Keider Montero (R) | Gage Jump (L) |
| Jul 28, 2026 | SD 8 - COL 7 | W -230 | O 8.5 | Michael Lorenzen (R) | Michael King (R) |
| Jul 10, 2026 | STL 2 - ATL 1 | W +138 | U 7.5 | Chris Sale (L) | Kyle Leahy (R) |
| Jul 5, 2026 | LAA 5 - BOS 7 | L +140 | O 8.0 | Ranger Suarez (L) | Ryan Johnson (R) |
| Jun 30, 2026 | CHC 9 - SD 7 | W -154 | O 11.5 | JP Sears (L) | Matthew Boyd (L) |
| Jun 26, 2026 | PIT 4 - CIN 6 | L -184 | O 7.5 | Andrew Abbott (L) | Paul Skenes (R) |
| Date | Score | Line | O/U | Road Starter | Home Starter |
|---|---|---|---|---|---|
| Jul 5, 2026 | LAA 5 - BOS 7 | L +140 | O 8.0 | Ranger Suarez (L) | Ryan Johnson (R) |
| Date | Score | Line | O/U | Road Starter | Home Starter |
|---|---|---|---|---|---|
| Mar 30, 2026 | MIL 2 - TB 3 | L -158 | U 8.0 | Nick Martinez (R) | Kyle Harrison (L) |
| Feb 21, 2026 | TB 1 - ATL 5 | L -155 | U 9.0 | Carlos Carrasco (R) | - |
| Date | Score | Line | O/U | Road Starter | Home Starter |
|---|
| Date | Score | Line | O/U | Road Starter | Home Starter |
|---|---|---|---|---|---|
| May 17, 2026 | NYM 7 - NYY 6 | W -120 | O 8.0 | Elmer Rodriguez (R) | Freddy Peralta (R) |
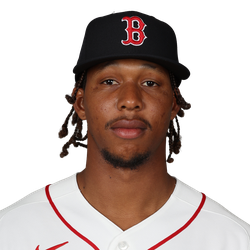 Brayan Bello (R)
Last 5
|
Date
Score
|
Line | O/U | IP | H | R | ER | SO | BB | HR | PIT | P/IP | GB:FB |
|---|---|---|---|---|---|---|---|---|---|---|---|---|
|
Sep 07, '26
BOS 5 - LAA 2
|
W -181 | u8.5 | 5.0 | 4 | 0 | 0 | 7 | 2 | 0 | 103 | 20.6 | 0.8 |
|
Jun 04, '26
BOS 2 - BAL 8
|
L -116 | u10.5 | 5.0 | 7 | 8 | 8 | 4 | 3 | 0 | 108 | 21.6 | 1.5 |
|
May 17, '26
ATL 8 - BOS 1
|
L +124 | o8.5 | 5.0 | 8 | 7 | 7 | 1 | 3 | 2 | 98 | 19.6 | 1.4 |
|
Apr 29, '26
TOR 8 - BOS 1
|
L -102 | o8.5 | 3.2 | 6 | 4 | 4 | 2 | 2 | 0 | 63 | 17.2 | 1.0 |
|
Apr 24, '26
BAL 10 - BOS 3
|
L +106 | o8.5 | 3.1 | 13 | 8 | 8 | 2 | 1 | 5 | 85 | 25.5 | 2.0 |
| Last 5 Avg. | 4.1 | 7.6 | 5.4 | 5.4 | 3.2 | 2.2 | 1.4 | 91.4 | 20.9 | 1.3 |
|
Date
Score
|
Line | O/U | IP | H | R | ER | SO | BB | HR | PIT | P/IP | GB:FB |
|---|---|---|---|---|---|---|---|---|---|---|---|---|
|
Jul 13, '25
BOS 4 - TB 1
|
W -120 | u8.5 | 6.1 | 6 | 1 | 1 | 5 | 0 | 0 | 105 | 16.6 | 1.2 |
|
Jun 09, '25
BOS 8 - TB 10
|
L -108 | o8.0 | 6.1 | 7 | 4 | 3 | 4 | 1 | 0 | 82 | 12.9 | 4.0 |
|
Sep 19, '24
TB 2 - BOS 0
|
L -108 | u8.0 | 5.2 | 5 | 1 | 1 | 7 | 2 | 0 | 101 | 17.8 | 5.0 |
| Last 3 Avg. | 6.0 | 6.0 | 2.0 | 1.7 | 5.3 | 1.0 | 0.0 | 96.0 | 15.8 | 3.4 |
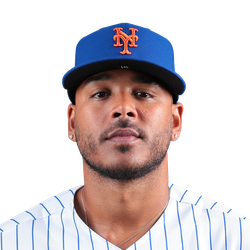 Freddy Peralta (R)
Last 5
|
Date
Score
|
Line | O/U | IP | H | R | ER | SO | BB | HR | PIT | P/IP | GB:FB |
|---|---|---|---|---|---|---|---|---|---|---|---|---|
|
Sep 13, '26
TB 14 - HOU 4
|
W -133 | o8.0 | 5.0 | 0 | 0 | 0 | 4 | 3 | 0 | 86 | 17.2 | 1.0 |
|
Sep 08, '26
ATL 1 - TB 7
|
W -103 | u8.5 | 6.0 | 5 | 1 | 1 | 2 | 1 | 0 | 92 | 15.3 | 1.0 |
|
Sep 01, '26
TB 6 - NYM 2
|
W -136 | o7.5 | 6.0 | 3 | 1 | 1 | 7 | 0 | 1 | 74 | 12.3 | 1.0 |
|
Aug 26, '26
DET 0 - TB 3
|
W +108 | u7.5 | 6.0 | 2 | 0 | 0 | 4 | 0 | 0 | 81 | 13.5 | 0.7 |
|
Aug 21, '26
BAL 5 - TB 3
|
L +106 | o7.5 | 7.0 | 7 | 5 | 5 | 6 | 1 | 2 | 98 | 14.0 | 1.5 |
| Last 5 Avg. | 6.0 | 3.4 | 1.4 | 1.4 | 4.6 | 1.0 | 0.6 | 86.2 | 14.5 | 1.0 |
|
Date
Score
|
Line | O/U | IP | H | R | ER | SO | BB | HR | PIT | P/IP | GB:FB |
|---|---|---|---|---|---|---|---|---|---|---|---|---|
|
Jul 11, '26
NYM 0 - BOS 4
|
W +119 | u8.0 | 4.1 | 3 | 2 | 2 | 6 | 5 | 1 | 92 | 21.2 | 1.0 |
|
May 28, '25
MIL 6 - BOS 5
|
W -143 | o7.5 | 5.0 | 6 | 3 | 3 | 6 | 3 | 1 | 108 | 21.6 | 2.5 |
|
Apr 21, '23
MIL 3 - BOS 5
|
L -164 | u9.0 | 5.2 | 5 | 4 | 4 | 4 | 2 | 1 | 99 | 17.5 | 1.7 |
| Last 3 Avg. | 5.0 | 4.7 | 3.0 | 3.0 | 5.3 | 3.3 | 1.0 | 99.7 | 20.1 | 1.7 |


