


| Overall | After Win | After Loss | |
|---|---|---|---|
| Game 1 | 29-18 | 17-10 | 12-8 |
| Game 2 | 27-20 | 19-10 | 8-10 |
| Game 3 | 29-16 | 19-7 | 10-9 |
| Game 4 | 2-4 | 1-3 | 1-1 |
| Overall | After Win | After Loss | |
|---|---|---|---|
| Game 1 | 28-21 | 17-12 | 11-9 |
| Game 2 | 25-22 | 15-12 | 10-10 |
| Game 3 | 28-15 | 13-11 | 15-4 |
| Game 4 | 4-3 | 4-1 | 0-2 |

| Team | R | H | E | 1 | 2 | 3 | 4 | 5 | 6 | 7 | 8 | 9 |
|---|---|---|---|---|---|---|---|---|---|---|---|---|
 TB
Tampa Bay |
1 | 5 | 0 | 0 | 0 | 0 | 0 | 0 | 0 | 0 | 0 | 1 |
 ATL
Atlanta |
3 | 7 | 0 | 0 | 0 | 0 | 0 | 0 | 0 | 0 | 3 | 0 |
Tampa Bay Pitcher
 K. Kelly
(L)
Atlanta Pitcher
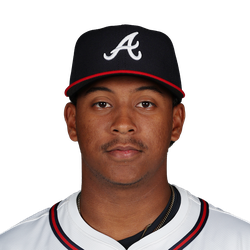 D. Fuentes
(W)
| Team | ML | O/U (Margin) | ATS (Margin) |
|---|---|---|---|
|
TB
Tampa Bay
|
+113 | 8.5o | +1.5 |
|
ATL
Atlanta
|
-136 | 8.5u (4.5) | -1.5 (0.5) |
| POS | AB | R | H | RBI | BB | SO | LOB | AVG | |
|---|---|---|---|---|---|---|---|---|---|
| Y. Diaz | DH | 4 | 0 | 1 | 0 | 0 | 1 | 0 | .305 |
| R. Vilade | 1B | 4 | 0 | 1 | 0 | 0 | 2 | 0 | .262 |
| J. Caminero | 3B | 3 | 0 | 0 | 0 | 1 | 0 | 2 | .280 |
| J. DeLuca | RF | 3 | 0 | 2 | 0 | 0 | 0 | 0 | .262 |
| V. Mesa Jr. | PH | 1 | 1 | 1 | 1 | 0 | 0 | 0 | .242 |
| C. Simpson | LF | 3 | 0 | 0 | 0 | 1 | 0 | 5 | .308 |
| N. Madrigal | 2B | 3 | 0 | 0 | 0 | 0 | 0 | 0 | .000 |
| L. Hicks | PH | 1 | 0 | 0 | 0 | 0 | 1 | 1 | .307 |
| J. Mateo | SS | 3 | 0 | 0 | 0 | 0 | 1 | 0 | .240 |
| J. Aranda | PH | 1 | 0 | 0 | 0 | 0 | 0 | 1 | .277 |
| N. Fortes | C | 2 | 0 | 0 | 0 | 1 | 0 | 0 | .263 |
| C. Mullins | CF | 3 | 0 | 0 | 0 | 0 | 1 | 1 | .204 |
| Totals | 31 | 1 | 5 | 1 | 3 | 6 | 10 | ||
Battling
Fielding
| POS | AB | R | H | RBI | BB | SO | LOB | AVG | |
|---|---|---|---|---|---|---|---|---|---|
| D. Baldwin | C | 4 | 0 | 1 | 0 | 0 | 1 | 0 | .276 |
| R. Acuna Jr. | RF | 4 | 0 | 0 | 0 | 0 | 0 | 2 | .250 |
| M. Olson | 1B | 3 | 0 | 1 | 0 | 0 | 0 | 0 | .249 |
| M. Harris II | CF | 3 | 0 | 0 | 0 | 0 | 0 | 1 | .286 |
| M. Dubon | 2B | 3 | 0 | 0 | 0 | 0 | 0 | 0 | .264 |
| D. Smith | DH | 2 | 0 | 0 | 0 | 0 | 1 | 0 | .256 |
| O. Albies | PH -DH | 1 | 1 | 1 | 0 | 0 | 0 | 0 | .249 |
| A. Riley | 3B | 3 | 1 | 1 | 1 | 0 | 1 | 0 | .223 |
| B. Hicklen | LF | 2 | 0 | 0 | 0 | 0 | 0 | 0 | .333 |
| M. Yastrzemski | PH -LF | 1 | 1 | 1 | 0 | 0 | 0 | 0 | .224 |
| H. Kim | SS | 3 | 0 | 2 | 2 | 0 | 0 | 0 | .126 |
| Totals | 29 | 3 | 7 | 3 | 0 | 3 | 3 | ||
Battling
Baserunning
Fielding
| IP | H | R | ER | BB | SO | HR | ERA | |
|---|---|---|---|---|---|---|---|---|
| N. Martinez | 6 .1 | 2 | 0 | 0 | 0 | 3 | 0 | 2.92 |
| C. Booser | 0 .2 | 0 | 0 | 0 | 0 | 0 | 0 | 2.27 |
| K. Kelly (L 6-4) | 0 .1 | 4 | 3 | 3 | 0 | 0 | 0 | 2.51 |
| C. Legumina | 0 .2 | 1 | 0 | 0 | 0 | 0 | 0 | 3.52 |
| IP | H | R | ER | BB | SO | HR | ERA | |
|---|---|---|---|---|---|---|---|---|
| M. Perez | 7 .0 | 4 | 0 | 0 | 2 | 4 | 0 | 3.08 |
| D. Fuentes (W 6-2) | 1 .0 | 0 | 0 | 0 | 0 | 1 | 0 | 2.31 |
| R. Iglesias (S 32) | 1 .0 | 1 | 1 | 1 | 1 | 1 | 1 | 2.83 |
Location Truist Park
Temperature 91° Temperature
Attendance 31,664 attendance
Home Jansen Visconti
1st Nick Mahrley
2nd Lance Barrett
3rd Willie Traynor
| Date | Home | Result | ML | O/U | TB Starter (IP) | ATL Starter (IP) |
|---|---|---|---|---|---|---|
| Sep 09, '26 | ATL |
7 - 2
|
TB +104 | o8.0 | G. Jax (5.0) | R. Lopez (4.2) |
| Sep 08, '26 | ATL |
7 - 1
|
TB -103 | u8.5 | F. Peralta (6.0) | A. Smith-Shawver (3.1) |
| Apr 13, '25 | TB |
8 - 3
|
TB +151 | o8.5 | J. Boyle (5.0) | C. Sale (4.1) |
| Apr 12, '25 | TB |
5 - 4
|
ATL +116 | o8.5 | D. Rasmussen (5.0) | A. Smith-Shawver (5.0) |
| Apr 11, '25 | TB |
6 - 3
|
TB -131 | P9.0 | T. Bradley (6.0) | B. Elder (6.0) |
| Jun 16, '24 | ATL |
8 - 6
|
TB +110 | o9.0 | Z. Eflin (5.2) | H. Waldrep (3.1) |
| Jun 15, '24 | ATL |
9 - 2
|
ATL -120 | o9.0 | R. Pepiot (4.2) | C. Morton (6.0) |
| Jun 14, '24 | ATL |
7 - 3
|
ATL -212 | o8.5 | Z. Littell (2.0) | C. Sale (7.0) |
| Jul 09, '23 | TB |
10 - 4
|
TB -120 | o8.5 | Z. Eflin (5.0) | B. Elder (3.1) |
| Jul 08, '23 | TB |
6 - 1
|
ATL -139 | u8.0 | T. Bradley (5.0) | S. Strider (6.1) |
Last Meeting ( Sep 9, 2026 ) Tampa Bay 7, Atlanta 2
Nick Martinez, Tampa Bay's picture of pitching consistency, will look to help the Rays clinch a potential playoff berth on Thursday afternoon when they play the finale of a three-game series against the host Atlanta Braves.
American League East-leading Tampa Bay (87-58) has a magic number of two to punch its ticket to the postseason for the first time since 2023. In order to qualify for the playoffs on Thursday, per MLB.com, the Rays will need to complete a series sweep of Atlanta and have either the Seattle Mariners defeat the Texas Rangers, or the Pittsburgh Pirates beat the Chicago White Sox.
The Braves (85-61) have lost three games in a row and four of their past five and have seen their lead in the National League East over the second-place Philadelphia Phillies melt to three games.
The Rays have 7-1 and 7-2 victories over Atlanta to begin the series and have won four of their past five games.
The right-handed Martinez (14-4, 3.04 ERA) will oppose veteran Atlanta left-hander Martin Perez (8-9, 3.25) in the finale on Thursday.
Martinez is coming off his career-high 14th quality start of the season when he defeated the Rangers on Friday, allowing three runs over 6 1/3 innings in a 7-6 victory. It was the 23rd time in 27 starts that he has surrendered three or fewer runs.
"Every (game) is very important right now," Martinez said. "That's got to be the focus -- doing whatever we can to just win ballgames."
Martinez will make his sixth career appearance (fifth start) against Atlanta, going 2-1 with a 2.81 ERA in those games. His most recent start against the Braves came in 2024, when he tossed seven scoreless innings while pitching for the Cincinnati Reds.
Perez continues to be a vital member of the Atlanta rotation. In his most recent start on Saturday, however, he allowed four runs in 3 2/3 innings in a 4-2 loss to Philadelphia.
"I was missing too far, and I'm not normally missing that far," said Perez, who walked four batters in the first inning. "I feel off-timing. I can't find my rhythm from my wind-up, even in the stretch, and I was missing too much. I think that was a problem in the game. I was not attacking and then was behind in the count most of the time. And then they just put a lot of damage against me."
Perez has made 20 career appearances (17 starts) against Tampa Bay, going 5-7 with a 6.04 ERA.
Tampa Bay's offense continues to be productive. The Rays have scored six or more runs in five consecutive games and produced 10 hits on Wednesday, with only one starter failing to record a hit.
Atlanta native Chandler Simpson played a big part of the win with two hits, two runs and a stolen base. Simpson's 41 steals lead the American League, and his .309 batting average is second to Houston's Yordan Alvarez (.312).
The Braves made a roster move on Wednesday when they designated Elieser Hernandez for assignment and recalled left-hander Bailey Falter from Triple-A Gwinnett.
Falter was acquired from Kansas City, along with outfielder Lane Thomas, at the trade deadline last month. Falter made seven appearances (one start) for Gwinnett and fired 10 1/3 scoreless innings. He made his Braves debut with two scoreless innings on Wednesday.
--Field Level Media
Tampa Bay's Injuries| Player | POS | Status | Date | Note |
|---|---|---|---|---|
| G. Jax | SP | Day To Day - Back( Sep 26, '26) | Sep 26, '26 | |
| Jax is not in the starting lineup for Sunday's (Sep. 27) game against the Phillies. | ||||
| C. Simpson | LF | Day To Day - Foot( Sep 26, '26) | Sep 26, '26 | |
| Simpson is not in the starting lineup for Sunday's (Sep. 27) game against the Phillies. | ||||
| T. Wells | RP | Fifteen Day IL - Forearm( Sep 14, '26) | Sep 14, '26 | |
| The Tampa Bay Rays placed Tyler Wells (RP) on the 15-day injured list with right forearm tightness. | ||||
| J. Melton | LF | Sixty Day IL - Hamstring( Sep 14, '26) | Sep 14, '26 | |
| The Tampa Bay Rays placed LF Jacob Melton on the 60-day injured list with a right hamstring strain. | ||||
| G. Cleavinger | RP | Fifteen Day IL - Forearm( Sep 04, '26) | Sep 04, '26 | |
| The Tampa Bay Rays placed Garrett Cleavinger (RP) on the 15-day injured list due to left forearm tightness. | ||||
| S. McClanahan | SP | Fifteen Day IL - Forearm( Sep 03, '26) | Sep 03, '26 | |
| The Tampa Bay Rays placed SP Shane McClanahan on the 15-day injured list with left forearm tightness. | ||||
| J. Heasley | RP | Sixty Day IL - Elbow( Jun 07, '26) | Jun 07, '26 | |
| The Tampa Bay Rays transferred RHP Jonathan Heasley from the 15-day injured list to the 60-day injured list due to a right elbow stress reaction. | ||||
| G. Lux | LF | Sixty Day IL - Shoulder( May 26, '26) | May 26, '26 | |
| The Tampa Bay Rays transferred OF Gavin Lux from the 10-day injured list to the 60-day injured list with a right shoulder impingement. | ||||
| R. Pepiot | SP | Sixty Day IL - Hip( Apr 30, '26) | Apr 30, '26 | |
| Pepiot will miss the remainder of the season after undergoing hip surgery according to Marc Topkin of the Tampa Bay Times. | ||||
| E. Uceta | RP | Sixty Day IL - Shoulder( Apr 23, '26) | Apr 23, '26 | |
| The Tampa Bay Rays transferred RHP Edwin Uceta to the 60-day injured list with right shoulder impingement. | ||||
Atlanta's Injuries| Player | POS | Status | Date | Note |
|---|---|---|---|---|
| H. Waldrep | SP | Sixty Day IL - Elbow( Sep 23, '26) | Sep 23, '26 | |
| The Atlanta Braves recalled SP Hurston Waldrep and placed him on the 60-day injured list due to a right elbow UCL injury. | ||||
| M. Perez | SP | Fifteen Day IL - Back( Sep 23, '26) | Sep 23, '26 | |
| The Atlanta Braves placed SP Martín Pérez on the 15-day injured list due to low back inflammation. | ||||
| R. Lopez | SP | Fifteen Day IL - Right Shoulder( Sep 14, '26) | Sep 14, '26 | |
| The Atlanta Braves placed Reynaldo López (SP) on the 15-day injured list due to right shoulder inflammation. | ||||
| L. Thomas | LF | Ten Day IL - Side( Sep 10, '26) | Sep 10, '26 | |
| The Atlanta Braves placed LF Lane Thomas on the 10-day injured list with a left intercostal strain. | ||||
| B. Elder | SP | Fifteen Day IL - Knee( Sep 08, '26) | Sep 08, '26 | |
| The Atlanta Braves placed SP Bryce Elder on the 15-day injured list due to a right knee injury. | ||||
| S. Strider | SP | Sixty Day IL - Elbow( Jun 16, '26) | Jun 16, '26 | |
| The Atlanta Braves transferred RHP Spencer Stride from the 15-day injured list to the 60-day injured list. | ||||
| J. Wentz | RP | Sixty Day IL - Knee( Mar 23, '26) | Mar 23, '26 | |
| The Atlanta Braves placed LHP Joey Wentz on the 60-day injured list with a right ACL tear. | ||||
| S. Schwellenbach | SP | Sixty Day IL - Elbow( Feb 09, '26) | Feb 09, '26 | |
| The Atlanta Braves placed RHP Spencer Schwellenbach on the 60-day injured list with right elbow inflammation. | ||||
| J. Jimenez | RP | Sixty Day IL - Knee( Feb 09, '26) | Feb 09, '26 | |
| The Atlanta Braves placed RHP Joe Jiménez on the 60-day injured list with a left articular cartilage injury. | ||||
2026
Jersey Number 0
Games Officiated 29
Home Team W/L 18-11
Home Avg. Margin 0.00
Home Money Total 222
| Umpire | G | W-L | AVG | PIT | STR | B | STR% | STR | BB | K/BB | HR | O/U |
|---|---|---|---|---|---|---|---|---|---|---|---|---|
| Jansen Visconti | 29 | 18-11 | 9.17 | 290.14 | 184.83 | 105.31 | 63.7 | 15.8 | 6.5 | 2.42 | 2.59 | 16-13 |
Game Stats | |
|---|---|
| Average | 9.17 |
| Starters Runs | 5.34 |
| BullPens Runs | 3.83 |
| Pitches | 290.1 |
| Strikes | 184.8 |
| Balls | 105.3 |
| Strike% | 63.70 % |
| SO | 15.8 |
| Walks | 6.5 |
| SO/Walks | 2.42 |
| HR | 2.6 |
Home Favourite |
Home Underdog |
||
|---|---|---|---|
| -101 to -120 | 4 - 3 | 100 to 110 | 0 - 2 |
| -121 to -140 | 7 - 2 | 111 to 130 | 0 - 0 |
| -141 to -160 | 3 - 0 | 131 to 150 | 0 - 1 |
| -161 to -180 | 3 - 0 | 151 to 170 | 0 - 2 |
| -181 + | 1 - 1 | 171 + | 0 - 0 |
Total |
Over | Under |
|---|---|---|
| 7 or less | 2 | 0 |
| 7.5 | 2 | 4 |
| 8 | 3 | 0 |
| 8.5 | 3 | 6 |
| 9 | 3 | 1 |
| 9.5 | 1 | 0 |
| 10 | 1 | 0 |
| 10.5 | 0 | 1 |
| 11 | 1 | 0 |
| 11.5 | 0 | 0 |
| 12 | 0 | 1 |
| 12.5 | 0 | 0 |
| 13+ | 0 | 0 |
| Date | Score | Line | O/U | Road Starter | Home Starter |
|---|---|---|---|---|---|
| Aug 29, 2026 | TB 7 - SD 6 | W -126 | O 8.0 | Walker Buehler (R) | Nick Martinez (R) |
| Aug 26, 2026 | STL 7 - BAL 8 | L +100 | O 8.5 | Kyle Bradish (R) | Michael McGreevy (R) |
| Aug 17, 2026 | KC 9 - ATH 5 | W -180 | O 9.0 | Mason Barnett (R) | Michael Wacha (R) |
| Aug 11, 2026 | ATL 4 - NYM 0 | W -125 | U 8.5 | Nolan McLean (R) | Martin Perez (L) |
| Aug 7, 2026 | STL 3 - COL 2 | W -164 | U 8.5 | Ryan Feltner (R) | Kyle Leahy (R) |
| Jul 26, 2026 | PIT 8 - CHC 7 | W -144 | O 9.0 | Jameson Taillon (R) | Braxton Ashcraft (R) |
| Jul 21, 2026 | MIL 0 - NYM 4 | L -134 | U 8.5 | Zac Thornton (L) | Brandon Sproat (R) |
| Jul 17, 2026 | COL 2 - CIN 7 | L -116 | U 12.0 | Brady Singer (R) | Gabriel Hughes (R) |
| Jul 2, 2026 | PHI 1 - PIT 6 | L -130 | U 10.5 | Jared Jones (R) | Alan Rangel (R) |
| Jun 28, 2026 | BAL 4 - WAS 6 | L -196 | O 9.5 | Zack Littell (R) | Kyle Bradish (R) |
| Date | Score | Line | O/U | Road Starter | Home Starter |
|---|---|---|---|---|---|
| Aug 29, 2026 | TB 7 - SD 6 | W -126 | O 8.0 | Walker Buehler (R) | Nick Martinez (R) |
| Date | Score | Line | O/U | Road Starter | Home Starter |
|---|---|---|---|---|---|
| Aug 11, 2026 | ATL 4 - NYM 0 | W -125 | U 8.5 | Nolan McLean (R) | Martin Perez (L) |
| Feb 22, 2026 | ATL 1 - MIN 8 | L -192 | O 8.5 | Taj Bradley (R) | Chris Sale (L) |
| Date | Score | Line | O/U | Road Starter | Home Starter |
|---|---|---|---|---|---|
| Aug 29, 2026 | TB 7 - SD 6 | W -126 | O 8.0 | Walker Buehler (R) | Nick Martinez (R) |
| Date | Score | Line | O/U | Road Starter | Home Starter |
|---|---|---|---|---|---|
| Aug 11, 2026 | ATL 4 - NYM 0 | W -125 | U 8.5 | Nolan McLean (R) | Martin Perez (L) |
 Nick Martinez (R)
Last 5
|
Date
Score
|
Line | O/U | IP | H | R | ER | SO | BB | HR | PIT | P/IP | GB:FB |
|---|---|---|---|---|---|---|---|---|---|---|---|---|
|
Sep 04, '26
TEX 6 - TB 7
|
W +100 | o8.5 | 6.1 | 5 | 3 | 3 | 4 | 2 | 1 | 90 | 14.2 | 1.7 |
|
Aug 29, '26
TB 7 - SD 6
|
W -126 | o8.0 | 6.0 | 7 | 3 | 3 | 4 | 0 | 1 | 81 | 13.5 | 1.6 |
|
Aug 23, '26
BAL 1 - TB 3
|
W -102 | u8.5 | 6.0 | 1 | 0 | 0 | 4 | 0 | 0 | 86 | 14.3 | 0.8 |
|
Aug 18, '26
TB 5 - TOR 10
|
L -126 | o7.5 | 3.2 | 9 | 6 | 6 | 5 | 2 | 1 | 82 | 22.4 | 2.0 |
|
Aug 11, '26
ATH 4 - TB 12
|
W -182 | o10.5 | 9.0 | 8 | 4 | 4 | 5 | 0 | 1 | 101 | 11.2 | 1.5 |
| Last 5 Avg. | 6.0 | 6.0 | 3.2 | 3.2 | 4.4 | 0.8 | 0.8 | 88.0 | 15.1 | 1.5 |
|
Date
Score
|
Line | O/U | IP | H | R | ER | SO | BB | HR | PIT | P/IP | GB:FB |
|---|---|---|---|---|---|---|---|---|---|---|---|---|
|
Sep 09, '24
ATL 0 - CIN 1
|
W +135 | u8.5 | 7.0 | 2 | 0 | 0 | 5 | 1 | 0 | 97 | 13.9 | 0.8 |
|
Apr 19, '23
SD 1 - ATL 0
|
W +106 | u8.5 | 7.0 | 3 | 0 | 0 | 6 | 2 | 0 | 97 | 13.9 | 1.2 |
|
Apr 07, '23
ATL 4 - SD 5
|
W +109 | u9.5 | 4.2 | 4 | 4 | 4 | 4 | 5 | 1 | 101 | 21.6 | 2.3 |
| Last 3 Avg. | 6.0 | 3.0 | 1.3 | 1.3 | 5.0 | 2.7 | 0.3 | 98.3 | 16.5 | 1.5 |
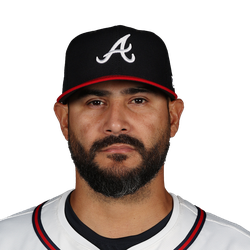 Martin Perez (L)
Last 5
|
Date
Score
|
Line | O/U | IP | H | R | ER | SO | BB | HR | PIT | P/IP | GB:FB |
|---|---|---|---|---|---|---|---|---|---|---|---|---|
|
Sep 05, '26
PHI 4 - ATL 2
|
L +137 | u8.0 | 3.2 | 7 | 4 | 4 | 3 | 4 | 1 | 84 | 22.9 | 0.7 |
|
Aug 29, '26
ATL 2 - COL 1
|
W -225 | u8.5 | 5.2 | 5 | 1 | 1 | 6 | 2 | 0 | 83 | 14.6 | 3.0 |
|
Aug 22, '26
MIL 4 - ATL 1
|
L +144 | u7.5 | 4.0 | 4 | 4 | 1 | 2 | 3 | 1 | 97 | 24.3 | 6.0 |
|
Aug 17, '26
MIN 4 - ATL 2
|
L -128 | u9.0 | 5.0 | 9 | 4 | 4 | 3 | 2 | 0 | 82 | 16.4 | 2.0 |
|
Aug 11, '26
ATL 4 - NYM 0
|
W -125 | u8.5 | 6.0 | 4 | 0 | 0 | 2 | 3 | 0 | 82 | 13.7 | 2.3 |
| Last 5 Avg. | 4.2 | 5.8 | 2.6 | 2.0 | 3.2 | 2.8 | 0.4 | 85.6 | 18.4 | 2.8 |
|
Date
Score
|
Line | O/U | IP | H | R | ER | SO | BB | HR | PIT | P/IP | GB:FB |
|---|---|---|---|---|---|---|---|---|---|---|---|---|
|
Aug 30, '24
TB 5 - SD 13
|
W +113 | o7.5 | 5.0 | 7 | 4 | 4 | 4 | 3 | 1 | 101 | 20.2 | 0.8 |
|
Jun 11, '23
TB 7 - TEX 3
|
L +169 | o8.5 | 3.1 | 10 | 7 | 7 | 2 | 3 | 1 | 75 | 22.5 | 1.5 |
|
Sep 16, '22
TB 3 - TEX 4
|
W +140 | p7.0 | 5.1 | 9 | 3 | 3 | 3 | 1 | 0 | 91 | 17.1 | 2.7 |
| Last 3 Avg. | 4.1 | 8.7 | 4.7 | 4.7 | 3.0 | 2.3 | 0.7 | 89.0 | 19.9 | 1.7 |


