


| Overall | After Win | After Loss | |
|---|---|---|---|
| Game 1 | 21-18 | 12-9 | 14-11 |
| Game 2 | 14-24 | 13-13 | 6-14 |
| Game 3 | 20-18 | 8-11 | 14-13 |
| Game 4 | 2-2 | 2-1 | 0-3 |
| Overall | After Win | After Loss | |
|---|---|---|---|
| Game 1 | 21-18 | 13-7 | 8-11 |
| Game 2 | 16-22 | 6-14 | 10-8 |
| Game 3 | 19-19 | 9-7 | 10-12 |
| Game 4 | 3-2 | 2-0 | 1-2 |

| Team | R | H | E | 1 | 2 | 3 | 4 | 5 | 6 | 7 | 8 | 9 |
|---|---|---|---|---|---|---|---|---|---|---|---|---|
 BAL
Baltimore |
5 | 11 | 1 | 2 | 2 | 1 | 0 | 0 | 0 | 0 | 0 | 0 |
 MIN
Minnesota |
2 | 7 | 0 | 0 | 1 | 1 | 0 | 0 | 0 | 0 | 0 | 0 |
| Team | ML | O/U (Margin) | ATS (Margin) |
|---|---|---|---|
|
BAL
Baltimore
|
+102 | 9o | -1.5 (1.5) |
|
MIN
Minnesota
|
-109 | 9u (2) | +1.5 |
| POS | AB | R | H | RBI | BB | SO | LOB | AVG | |
|---|---|---|---|---|---|---|---|---|---|
| G. Henderson | SS | 5 | 2 | 3 | 2 | 0 | 1 | 0 | .216 |
| P. Alonso | 1B | 4 | 1 | 3 | 2 | 1 | 1 | 1 | .256 |
| J. Holliday | 2B | 4 | 0 | 0 | 0 | 1 | 1 | 2 | .246 |
| T. O'Neill | RF | 4 | 0 | 1 | 0 | 0 | 2 | 0 | .216 |
| C. Encarnacion-Strand | 3B | 4 | 1 | 3 | 1 | 0 | 0 | 0 | .271 |
| C. Mayo | DH | 3 | 0 | 0 | 0 | 1 | 1 | 1 | .214 |
| C. Franklin | CF -LF | 4 | 0 | 0 | 0 | 0 | 1 | 3 | .083 |
| J. Jackson | LF | 4 | 0 | 0 | 0 | 0 | 1 | 1 | .232 |
| C. Cowser | CF | 0 | 0 | 0 | 0 | 0 | 0 | 0 | .212 |
| Y. Pozo | C | 1 | 1 | 1 | 0 | 0 | 0 | 0 | .300 |
| C. Narvaez | C | 3 | 0 | 0 | 0 | 0 | 1 | 0 | .100 |
| Totals | 36 | 5 | 11 | 5 | 3 | 9 | 8 | ||
Battling
Baserunning
Fielding
| POS | AB | R | H | RBI | BB | SO | LOB | AVG | |
|---|---|---|---|---|---|---|---|---|---|
| T. Larnach | LF | 5 | 0 | 0 | 0 | 0 | 0 | 4 | .272 |
| R. Jeffers | C | 5 | 1 | 1 | 0 | 0 | 1 | 1 | .281 |
| J. Bell | DH | 3 | 0 | 0 | 0 | 1 | 1 | 1 | .251 |
| K. Clemens | 2B | 3 | 0 | 0 | 0 | 1 | 2 | 3 | .229 |
| R. Lewis | 1B | 4 | 1 | 2 | 0 | 0 | 1 | 3 | .242 |
| B. Lee | 3B | 4 | 0 | 2 | 1 | 0 | 0 | 2 | .245 |
| L. Keaschall | CF | 1 | 0 | 1 | 0 | 2 | 0 | 0 | .265 |
| A. Roden | RF | 4 | 0 | 0 | 1 | 0 | 1 | 8 | .192 |
| K. Culpepper | SS | 4 | 0 | 1 | 0 | 0 | 1 | 5 | .154 |
| Totals | 33 | 2 | 7 | 2 | 4 | 7 | 27 | ||
Battling
Fielding
| IP | H | R | ER | BB | SO | HR | ERA | |
|---|---|---|---|---|---|---|---|---|
| B. Young (W 9-3) | 6 .0 | 6 | 2 | 1 | 3 | 4 | 0 | 3.33 |
| J. Walker (H 1) | 1 .0 | 0 | 0 | 0 | 0 | 1 | 0 | 3.21 |
| Y. Cano (H 11) | 1 .0 | 1 | 0 | 0 | 1 | 1 | 0 | 1.99 |
| A. Kittredge (S 6) | 1 .0 | 0 | 0 | 0 | 0 | 1 | 0 | 3.57 |
| IP | H | R | ER | BB | SO | HR | ERA | |
|---|---|---|---|---|---|---|---|---|
| B. Ober (L 7-4) | 6 .0 | 8 | 5 | 5 | 1 | 4 | 3 | 4.64 |
| K. Funderburk | 1 .0 | 2 | 0 | 0 | 1 | 1 | 0 | 2.84 |
| T. Nance | 1 .0 | 1 | 0 | 0 | 0 | 2 | 0 | 1.59 |
| T. Rogers | 1 .0 | 0 | 0 | 0 | 1 | 2 | 0 | 5.27 |
Location Target Field
Temperature 82° Temperature
Attendance 21,677 attendance
Home Todd Tichenor
1st Tyler Jones
2nd Bruce Dreckman
3rd Adam Hamari
| Date | Home | Result | ML | O/U | BAL Starter (IP) | MIN Starter (IP) |
|---|---|---|---|---|---|---|
| Aug 10, '26 | MIN |
9 - 5
|
MIN -104 | o8.5 | T. Rogers (4.0) | D. Kremer (7.0) |
| Mar 29, '26 | BAL |
8 - 6
|
BAL -154 | o9.0 | S. Baz (5.1) | B. Ober (4.0) |
| Mar 28, '26 | BAL |
4 - 1
|
MIN +136 | u7.5 | K. Bradish (4.2) | T. Bradley (4.1) |
| Mar 26, '26 | BAL |
2 - 1
|
BAL -142 | u8.5 | T. Rogers (7.0) | J. Ryan (5.1) |
| May 15, '25 | BAL |
4 - 0
|
MIN +112 | u9.0 | T. Sugano (6.1) | C. Paddack (7.0) |
| May 14, '25 | BAL |
8 - 6
|
MIN +108 | o9.0 | C. McDermott (3.0) | S. Woods Richardson (4.0) |
| May 14, '25 | BAL |
6 - 3
|
MIN +106 | o8.5 | D. Kremer (5.2) | B. Ober (4.2) |
| May 08, '25 | MIN |
5 - 2
|
MIN -166 | u8.5 | D. Kremer (7.0) | B. Ober (5.0) |
| May 07, '25 | MIN |
5 - 2
|
MIN -136 | u9.0 | C. Morton (4.0) | S. Woods Richardson (4.2) |
| May 06, '25 | MIN |
9 - 1
|
MIN -172 | o9.0 | C. Povich (6.0) | P. Lopez (5.0) |
Last Meeting ( Aug 10, 2026 ) Baltimore 5, Minnesota 9
Dean Kremer got his revenge.
Now the Baltimore Orioles will try to get revenge for Kremer's revenge.
One night after Kremer shut down his former team, which shipped him to Minnesota before the trade deadline, the Orioles will look to bounce back. They will take on the Twins in the second installment of a three-game series on Tuesday evening in Minneapolis.
Minnesota held on for a 9-5 win in the series opener on Monday thanks in large part to Kremer, who limited the Orioles to one run on one hit in seven innings. It was his first career appearance against the Orioles, his team from 2020 until last week.
"We've seen Dean do that before," Orioles infielder Jackson Holliday said. "It sucks that he did it to us."
The Twins will go for a series win as they look to keep the pressure on the first-place Chicago White Sox in the American League Central. Minnesota is two games below .500 but trails the White Sox by only 3 1/2 games for the division lead and is just 1 1/2 games off the final AL wild-card position.
Baltimore is five games below .500 and three games back of the Texas Rangers, who hold the last AL wild-card spot.
Twins right-hander Bailey Ober (7-3, 4.45 ERA) is set to make his 18th start of the season on Tuesday. Ober will try to post his third quality start in a row, and he is seeking his first victory since July 17.
In his most recent performance, Ober drew a no-decision on Thursday after limiting the Kansas City Royals to three runs on six hits in six innings. He threw 50 of 74 pitches for strikes.
Ober has faced the Orioles six times in his career. He is 1-1 with a 3.13 ERA in those starts, having walked eight and struck out 27 in 31 2/3 innings. In his lone meeting with Baltimore this year, Ober lasted four innings and permitted three runs in a no-decision on March 29.
Baltimore will counter with right-hander Brandon Young (8-3, 3.43 ERA), who will make his 20th start. Young is looking to earn his first victory since July 19.
On Thursday against the Los Angeles Angels, Young took the loss after allowing three runs on six hits in 4 1/3 innings. He walked two and struck out four.
This will be Young's first career appearance against Minnesota.
Twins outfielder Byron Buxton remains sidelined because of a right hip injury, but he offered reason for optimism after taking batting practice and running the bases before the Monday game.
Twins general manager Jeremy Zoll indicated that Buxton could return sometime this week.
"The plan is to see how he comes in (Tuesday)," Zoll said. "We're just trying to get a sense of how he's recovering from all the activities, and then (we're) hopeful for activation within the next few days."
Buxton knows that he will have to be smart running the bases to avoid aggravating the injury. Caution does not come easily to the veteran, who prefers to be aggressive in his running.
"That'll probably be the hardest part for me," Buxton said. "Other than figuring out the running part is figuring out how to contain it. ... It's just (about) keeping me on the field now. I'm getting back to feeling good, so I want to stay on the field."
--Field Level Media
Baltimore's Injuries| Player | POS | Status | Date | Note |
|---|---|---|---|---|
| K. Bradish | SP | Sixty Day IL - Lower Abdominal( Sep 23, '26) | Sep 23, '26 | |
| The Baltimore Orioles placed SP Kyle Bradish on the 60-day injured list due to lower abdominal discomfort. | ||||
| S. Basallo | C | Seven Day IL - Concussion( Sep 22, '26) | Sep 22, '26 | |
| The Baltimore Orioles placed Samuel Basallo (C) on the 7-day injured list due to Concussion. | ||||
| T. O'Neill | RF | Sixty Day IL - Shoulder( Sep 18, '26) | Sep 18, '26 | |
| The Baltimore Orioles transferred RF Tyler O'Neill to the 60-day injured list. | ||||
| J. Holliday | 2B | Ten Day IL - Wrist( Sep 15, '26) | Sep 15, '26 | |
| The Baltimore Orioles placed Jackson Holliday (2B) on the 10-day injured list due to left wrist inflammation. | ||||
| B. Alexander | 3B | Ten Day IL - Back( Sep 08, '26) | Sep 08, '26 | |
| The Baltimore Orioles placed Blaze Alexander (3B) on the 10-day injured list with a low back discomfort. | ||||
| L. Robert Jr. | CF | Ten Day IL - Hamstring( Sep 05, '26) | Sep 05, '26 | |
| The Baltimore Orioles placed Luis Robert (CF) on the 10-day injured list due to left hamstring discomfort. | ||||
| R. Mountcastle | 1B | Sixty Day IL - Foot( Jul 30, '26) | Jul 30, '26 | |
| The Baltimore Orioles said on Friday (Jul. 31) that INF Ryan Mountcastle pulled an oblique earlier this week and will now miss a couple more months. | ||||
| K. Akin | RP | Sixty Day IL - Elbow( Jul 12, '26) | Jul 12, '26 | |
| The Baltimore Orioles transferred LHP Keegan Akin from the 15-day injured list to the 60-day injured list due to left elbow discomfort. | ||||
| R. Helsley | RP | Sixty Day IL - Elbow( Jul 02, '26) | Jul 02, '26 | |
| The Baltimore Orioles transferred RHP Ryan Helsley to the 60-day injured list. | ||||
| Z. Eflin | SP | Sixty Day IL - Elbow( Apr 06, '26) | Apr 06, '26 | |
| The Baltimore Orioles transferred RHP Zach Eflin from the 15-day injured list to the 60-day injured list with right elbow discomfort. | ||||
| J. Westburg | 3B | Sixty Day IL - UCL( Mar 31, '26) | Mar 31, '26 | |
| Westburg will miss the remainder of the 2026 season according to Andy Kostka of The Baltimore Banner. | ||||
| C. Selby | SP | Sixty Day IL - Shoulder( Feb 13, '26) | Feb 13, '26 | |
| The Baltimore Orioles placed RHP Colin Selby on the 60-day injured list due to right shoulder inflammation. | ||||
Minnesota's Injuries| Player | POS | Status | Date | Note |
|---|---|---|---|---|
| J. Hoffman | RP | Fifteen Day IL - Forearm( Sep 25, '26) | Sep 25, '26 | |
| The Minnesota Twins placed Jeff Hoffman (RP) on the 15-day injured list. | ||||
| T. Larnach | LF | Ten Day IL - Wrist( Sep 17, '26) | Sep 17, '26 | |
| The Minnesota Twins placed LF Trevor Larnach on the 10-day injured list due to left wrist sprain. | ||||
| B. Buxton | CF | Ten Day IL - Hip( Sep 10, '26) | Sep 10, '26 | |
| The Minnesota Twins placed OF Byron Buxton on the 10-day injured list with right hip impingement. | ||||
| M. Paredes | SP | Sixty Day IL - Oblique( Jul 31, '26) | Jul 31, '26 | |
| The Minnesota Twins transferred RHP Mike Paredes from the 15-day injured list to the 60-day injured list with a left oblique strain. | ||||
| C. Sands | RP | Sixty Day IL - Elbow( Jul 30, '26) | Jul 30, '26 | |
| The Minnesota Twins transferred RHP Cole Sands from the 15-day injured list to the 60-day injured list due to right elbow strain. | ||||
| A. Banda | RP | Sixty Day IL - Lat( Jul 10, '26) | Jul 10, '26 | |
| The Minnesota Twins transferred LHP Anthony Banda from the 15-day injured list to the 60-day injured list with a left lat strain. | ||||
| M. Abel | SP | Sixty Day IL - Elbow( Jul 09, '26) | Jul 09, '26 | |
| The Minnesota Twins transferred RHP Mick Abel from the 15-day injured list to the 60-day injured list with right elbow inflammation. | ||||
| D. Festa | SP | Sixty Day IL - Shoulder( Apr 02, '26) | Apr 02, '26 | |
| The Minnesota Twins transferred RHP David Festa from the 15-day injured list to the 60-day injured list due to right shoulder impingement, retroactive to March 22. | ||||
| P. Lopez | SP | Sixty Day IL - Elbow( Feb 25, '26) | Feb 25, '26 | |
| The Minnesota Twins placed RHP Pablo Lopez on the 60-day injured list following his successful UCL repair surgery with an internal brace. | ||||
2026
Jersey Number 0
Games Officiated 31
Home Team W/L 17-14
Home Avg. Margin -0.10
Home Money Total -59
| Umpire | G | W-L | AVG | PIT | STR | B | STR% | STR | BB | K/BB | HR | O/U |
|---|---|---|---|---|---|---|---|---|---|---|---|---|
| Todd Tichenor | 31 | 17-14 | 8.94 | 287.16 | 183.94 | 103.23 | 64.1 | 15.9 | 6.4 | 2.48 | 1.84 | 15-16 |
Game Stats | |
|---|---|
| Average | 8.94 |
| Starters Runs | 4.97 |
| BullPens Runs | 3.97 |
| Pitches | 287.2 |
| Strikes | 183.9 |
| Balls | 103.2 |
| Strike% | 64.05 % |
| SO | 15.9 |
| Walks | 6.4 |
| SO/Walks | 2.48 |
| HR | 1.8 |
Home Favourite |
Home Underdog |
||
|---|---|---|---|
| -101 to -120 | 3 - 1 | 100 to 110 | 2 - 3 |
| -121 to -140 | 4 - 5 | 111 to 130 | 2 - 4 |
| -141 to -160 | 1 - 1 | 131 to 150 | 0 - 0 |
| -161 to -180 | 4 - 0 | 151 to 170 | 0 - 0 |
| -181 + | 1 - 0 | 171 + | 0 - 0 |
Total |
Over | Under |
|---|---|---|
| 7 or less | 0 | 2 |
| 7.5 | 4 | 2 |
| 8 | 2 | 2 |
| 8.5 | 4 | 7 |
| 9 | 1 | 1 |
| 9.5 | 1 | 1 |
| 10 | 2 | 0 |
| 10.5 | 0 | 0 |
| 11 | 0 | 0 |
| 11.5 | 1 | 0 |
| 12 | 0 | 1 |
| 12.5 | 0 | 0 |
| 13+ | 0 | 0 |
| Date | Score | Line | O/U | Road Starter | Home Starter |
|---|---|---|---|---|---|
| Aug 7, 2026 | PIT 4 - NYM 6 | L -130 | O 8.5 | Zac Thornton (L) | Carmen Mlodzinski (R) |
| Aug 2, 2026 | HOU 7 - TEX 3 | W -130 | O 8.5 | Kumar Rocker (R) | Peter Lambert (R) |
| Jul 29, 2026 | STL 3 - CHC 2 | W -112 | U 7.5 | Matthew Boyd (L) | Dustin May (R) |
| Jul 25, 2026 | TB 3 - CLE 0 | W -120 | U 8.0 | Tanner Bibee (R) | Nick Martinez (R) |
| Jul 20, 2026 | COL 3 - WAS 7 | L +112 | U 12.0 | Andrew Alvarez (L) | Kyle Freeland (L) |
| Jul 9, 2026 | STL 4 - MIL 8 | L +106 | O 8.5 | Logan Henderson (R) | Andre Pallante (R) |
| Jun 25, 2026 | BOS 6 - NYY 3 | W +126 | O 8.0 | Cam Schlittler (R) | Connelly Early (L) |
| Jun 21, 2026 | COL 6 - PIT 8 | L +122 | O 11.5 | Jared Jones (R) | Michael Lorenzen (R) |
| Jun 17, 2026 | SEA 3 - BAL 5 | L -134 | O 7.5 | Kyle Bradish (R) | George Kirby (R) |
| Jun 12, 2026 | SF 1 - CHC 5 | L -124 | U 8.5 | Javier Assad (R) | Landen Roupp (R) |
| Date | Score | Line | O/U | Road Starter | Home Starter |
|---|---|---|---|---|---|
| Jun 17, 2026 | SEA 3 - BAL 5 | L -134 | O 7.5 | Kyle Bradish (R) | George Kirby (R) |
| May 31, 2026 | BAL 9 - TOR 5 | W -134 | O 8.0 | Spencer Miles (R) | Kyle Bradish (R) |
| Date | Score | Line | O/U | Road Starter | Home Starter |
|---|
| Date | Score | Line | O/U | Road Starter | Home Starter |
|---|
| Date | Score | Line | O/U | Road Starter | Home Starter |
|---|
 Brandon Young (R)
Last 5
|
Date
Score
|
Line | O/U | IP | H | R | ER | SO | BB | HR | PIT | P/IP | GB:FB |
|---|---|---|---|---|---|---|---|---|---|---|---|---|
|
Aug 06, '26
BAL 1 - LAA 4
|
L -180 | u9.5 | 4.1 | 6 | 3 | 3 | 4 | 2 | 1 | 98 | 22.6 | 2.5 |
|
Jul 31, '26
BAL 6 - PHI 4
|
W -112 | o9.0 | 5.2 | 5 | 4 | 4 | 5 | 2 | 2 | 94 | 16.6 | 0.7 |
|
Jul 25, '26
BAL 3 - ATL 2
|
W -112 | u9.5 | 6.1 | 4 | 1 | 1 | 6 | 2 | 0 | 94 | 14.8 | 5.0 |
|
Jul 19, '26
HOU 2 - BAL 5
|
W +106 | u8.5 | 7.0 | 5 | 1 | 1 | 7 | 1 | 0 | 95 | 13.6 | 1.3 |
|
Jul 10, '26
BAL 5 - KC 3
|
W -156 | u10.5 | 7.0 | 8 | 3 | 3 | 5 | 1 | 2 | 85 | 12.1 | 1.7 |
| Last 5 Avg. | 6.0 | 5.6 | 2.4 | 2.4 | 5.4 | 1.6 | 1.0 | 93.2 | 16.0 | 2.2 |
|
Date
Score
|
Line | O/U | IP | H | R | ER | SO | BB | HR | PIT | P/IP | GB:FB |
|---|---|---|---|---|---|---|---|---|---|---|---|---|
| Brandon Young has not played against MIN Twins. | ||||||||||||
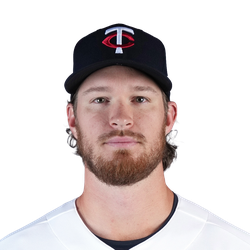 Bailey Ober (R)
Last 5
|
Date
Score
|
Line | O/U | IP | H | R | ER | SO | BB | HR | PIT | P/IP | GB:FB |
|---|---|---|---|---|---|---|---|---|---|---|---|---|
|
Aug 06, '26
KC 3 - MIN 4
|
W +116 | u8.5 | 6.0 | 6 | 3 | 3 | 0 | 0 | 0 | 74 | 12.3 | 0.8 |
|
Jul 30, '26
MIN 4 - KC 3
|
W -136 | u9.0 | 6.0 | 4 | 3 | 2 | 3 | 2 | 1 | 79 | 13.2 | 4.5 |
|
Jul 22, '26
CLE 6 - MIN 10
|
W +114 | o8.0 | 4.0 | 8 | 4 | 4 | 2 | 1 | 0 | 89 | 22.3 | 1.0 |
|
Jul 17, '26
CHC 2 - MIN 5
|
W +124 | u11.0 | 5.1 | 5 | 2 | 2 | 7 | 2 | 0 | 88 | 16.5 | 0.0 |
|
Jul 09, '26
MIN 2 - CLE 5
|
L +106 | u8.5 | 5.0 | 3 | 1 | 1 | 5 | 1 | 1 | 74 | 14.8 | 0.7 |
| Last 5 Avg. | 5.0 | 5.2 | 2.6 | 2.4 | 3.4 | 1.2 | 0.4 | 80.8 | 15.8 | 1.4 |
|
Date
Score
|
Line | O/U | IP | H | R | ER | SO | BB | HR | PIT | P/IP | GB:FB |
|---|---|---|---|---|---|---|---|---|---|---|---|---|
|
Mar 29, '26
BAL 8 - MIN 6
|
L +130 | o9.0 | 4.0 | 4 | 3 | 3 | 1 | 1 | 1 | 56 | 14.0 | 6.0 |
|
May 14, '25
BAL 3 - MIN 6
|
W +106 | o8.5 | 4.2 | 2 | 3 | 3 | 3 | 3 | 1 | 102 | 21.9 | 0.7 |
|
May 08, '25
MIN 5 - BAL 2
|
W -166 | u8.5 | 5.0 | 8 | 2 | 1 | 6 | 1 | 0 | 91 | 18.2 | 1.0 |
| Last 3 Avg. | 4.1 | 4.7 | 2.7 | 2.3 | 3.3 | 1.7 | 0.7 | 83.0 | 18.0 | 2.6 |


