


| Overall | After Win | After Loss | |
|---|---|---|---|
| Game 1 | 27-24 | 13-15 | 14-9 |
| Game 2 | 24-27 | 12-15 | 12-12 |
| Game 3 | 27-22 | 10-13 | 17-9 |
| Game 4 | 4-3 | 3-1 | 1-2 |
| Overall | After Win | After Loss | |
|---|---|---|---|
| Game 1 | 29-22 | 14-8 | 15-14 |
| Game 2 | 30-21 | 16-13 | 14-8 |
| Game 3 | 20-29 | 16-13 | 4-16 |
| Game 4 | 6-1 | 4-0 | 2-1 |

| Team | R | H | E | 1 | 2 | 3 | 4 | 5 | 6 | 7 | 8 | 9 |
|---|---|---|---|---|---|---|---|---|---|---|---|---|
 CLE
Cleveland |
1 | 4 | 0 | 0 | 1 | 0 | 0 | 0 | 0 | 0 | 0 | 0 |
 BOS
Boston |
0 | 3 | 1 | 0 | 0 | 0 | 0 | 0 | 0 | 0 | 0 | 0 |
Cleveland Pitcher
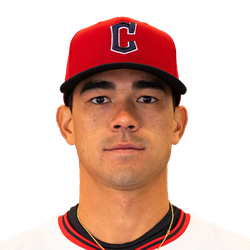 J. Cantillo
(W)
Boston Pitcher
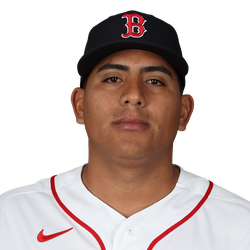 R. Suarez
(L)
| Team | ML | O/U (Margin) | ATS (Margin) |
|---|---|---|---|
|
CLE
Cleveland
|
+106 | 6.5o | +1.5 (2.5) |
|
BOS
Boston
|
-127 | 6.5u (5.5) | -1.5 |
| POS | AB | R | H | RBI | BB | SO | LOB | AVG | |
|---|---|---|---|---|---|---|---|---|---|
| S. Kwan | CF -LF | 3 | 0 | 0 | 0 | 1 | 0 | 0 | .280 |
| J. Ramirez | 3B | 4 | 0 | 2 | 0 | 0 | 1 | 0 | .237 |
| C. DeLauter | RF | 4 | 0 | 0 | 0 | 0 | 3 | 3 | .287 |
| P. Halpin | PR -CF | 0 | 0 | 0 | 0 | 0 | 0 | 0 | .224 |
| J. Adell | DH | 4 | 0 | 0 | 0 | 0 | 1 | 4 | .237 |
| A. Martinez | LF -RF | 4 | 1 | 1 | 1 | 0 | 0 | 2 | .258 |
| D. Fry | 1B | 4 | 0 | 1 | 0 | 0 | 1 | 1 | .193 |
| T. Bazzana | 2B | 3 | 0 | 0 | 0 | 0 | 1 | 1 | .243 |
| A. Genao | 2B | 0 | 0 | 0 | 0 | 0 | 0 | 0 | .211 |
| P. Bailey | C | 3 | 0 | 0 | 0 | 0 | 0 | 1 | .226 |
| B. Rocchio | SS | 3 | 0 | 0 | 0 | 0 | 1 | 0 | .249 |
| Totals | 32 | 1 | 4 | 1 | 1 | 8 | 12 | ||
Battling
Baserunning
Fielding
| POS | AB | R | H | RBI | BB | SO | LOB | AVG | |
|---|---|---|---|---|---|---|---|---|---|
| N. Sogard | 1B | 4 | 0 | 1 | 0 | 0 | 1 | 0 | .258 |
| M. Gasper | DH | 2 | 0 | 0 | 0 | 1 | 1 | 1 | .255 |
| A. Monasterio | PH -DH | 0 | 0 | 0 | 0 | 1 | 0 | 0 | .238 |
| A. Rutschman | C | 4 | 0 | 0 | 0 | 0 | 3 | 2 | .207 |
| W. Abreu | RF | 4 | 0 | 0 | 0 | 0 | 1 | 1 | .251 |
| C. Durbin | 3B | 3 | 0 | 0 | 0 | 1 | 1 | 0 | .250 |
| C. Rafaela | CF | 3 | 0 | 1 | 0 | 1 | 1 | 1 | .284 |
| J. Duran | LF | 3 | 0 | 1 | 0 | 0 | 0 | 2 | .208 |
| T. Story | SS | 3 | 0 | 0 | 0 | 0 | 2 | 2 | .240 |
| I. Kiner-Falefa | 2B | 3 | 0 | 0 | 0 | 0 | 2 | 1 | .237 |
| Totals | 29 | 0 | 3 | 0 | 4 | 12 | 10 | ||
Battling
Baserunning
Fielding
| IP | H | R | ER | BB | SO | HR | ERA | |
|---|---|---|---|---|---|---|---|---|
| D. Espino | 1 .0 | 0 | 0 | 0 | 0 | 2 | 0 | 4.40 |
| J. Cantillo (W 11-9) | 5 .0 | 2 | 0 | 0 | 2 | 4 | 0 | 3.62 |
| H. Gaddis (H 32) | 1 .0 | 1 | 0 | 0 | 1 | 1 | 0 | 2.73 |
| E. Sabrowski (H 27) | 1 .0 | 0 | 0 | 0 | 1 | 2 | 0 | 2.66 |
| C. Smith (S 41) | 1 .0 | 0 | 0 | 0 | 0 | 3 | 0 | 1.96 |
| IP | H | R | ER | BB | SO | HR | ERA | |
|---|---|---|---|---|---|---|---|---|
| R. Suarez (L 8-5) | 5 .0 | 3 | 1 | 1 | 1 | 5 | 1 | 3.22 |
| P. Sandoval | 1 .0 | 1 | 0 | 0 | 0 | 1 | 0 | 5.07 |
| E. Miller | 1 .0 | 0 | 0 | 0 | 0 | 1 | 0 | 3.38 |
| R. Burgos | 2 .0 | 0 | 0 | 0 | 0 | 1 | 0 | 4.66 |
Location Fenway Park
Temperature 57° Temperature
Attendance 36,711 attendance
Home Quinn Wolcott
1st Adrian Johnson
2nd Ramon De Jesus
3rd Paul Clemons
| Date | Home | Result | ML | O/U | CLE Starter (IP) | BOS Starter (IP) |
|---|---|---|---|---|---|---|
| Sep 23, '26 | BOS |
1 - 0
|
BOS -143 | u6.5 | F. Griffin (6.0) | S. Gray (6.0) |
| Sep 22, '26 | BOS |
3 - 2
|
CLE +104 | u6.0 | P. Messick (5.0) | P. Tolle (5.2) |
| May 31, '26 | CLE |
9 - 4
|
BOS -102 | o7.0 | T. Bibee (6.0) | R. Suarez (5.0) |
| May 30, '26 | CLE |
9 - 1
|
BOS +110 | o6.5 | P. Messick (5.0) | S. Gray (6.0) |
| May 29, '26 | CLE |
4 - 3
|
CLE -126 | u8.0 | S. Cecconi (4.1) | T. Samaniego (1.0) |
| Sep 03, '25 | BOS |
8 - 1
|
CLE +118 | o8.5 | J. Cantillo (6.0) | B. Bernardino (0.2) |
| Sep 02, '25 | BOS |
11 - 7
|
BOS -245 | o7.5 | S. Cecconi (5.1) | G. Crochet (6.0) |
| Sep 01, '25 | BOS |
6 - 4
|
BOS -144 | o8.0 | P. Messick (3.2) | B. Bello (5.0) |
| Apr 27, '25 | CLE |
13 - 3
|
BOS -114 | o7.5 | L. Allen (4.1) | B. Bello (6.0) |
| Apr 26, '25 | CLE |
7 - 3
|
BOS -117 | o7.5 | D. Nikhazy (3.0) | W. Buehler (6.0) |
Last Meeting ( Sep 23, 2026 ) Cleveland 0, Boston 1
A nor'easter is expected to hit Boston over the weekend, but the Red Sox and Cleveland Guardians have played with an October-like chill in the air this week.
With their eyes on the start of the postseason, the two American League contenders will complete their competitive three-game, penultimate series of the regular season on Thursday night at Fenway Park.
The Red Sox (85-73) snapped a three-game slide with a 1-0 win on Wednesday. Andruw Monasterio hit the go-ahead RBI single in the sixth inning after Sonny Gray pitched six shutout frames, lifting Boston to its AL-leading 17th shutout.
"You (have to) keep guys out there, engaged and ready to go," Red Sox manager Chad Tracy said. "I told the guys before, we earned the right to be in position to be able to line things up. That being said, we still want to go out and win the games."
The series will conclude with the rubber game, as Cleveland (82-76) was a 3-2 winner in the opener on Tuesday.
Given his postgame comments, the Red Sox hope to have avoided a scare regarding center fielder Ceddanne Rafaela, who left his first game back from the injured list with right hamstring tightness. A quad injury sent him to the IL on Sept. 3.
"Not even close," Rafaela said of the severity comparison of the two injuries. "I think it was just a cramp."
After the game, Tracy said Rafaela would have an MRI exam on Thursday.
Left-hander Ranger Suarez (8-4, 3.27 ERA), who will start for Boston on Thursday, carries a three-game win streak after a 5 2/3-inning outing Friday against the AL East champion Tampa Bay Rays. Suarez struck out five and allowed one run, working around three hits and five walks in a 4-2 victory.
"He's a very good competitor, a good pitcher that even when he gets traffic, you trust that he's going to find his way through it," Tracy said of Suarez, who has surrendered just two runs across his last 19 2/3 innings. His ERA in three September starts is 0.92.
Suarez is 1-1 with a 4.00 ERA in four career appearances (three starts) against Cleveland, including a May 31 road outing in which he struck out 10 and allowed four runs across five frames in a 9-4 win.
The Red Sox clinched a wild-card berth on Sunday. The Guardians are on the verge of sealing a postseason berth after entering Wednesday with a magic number of two, needing a win themselves and a loss by either the Texas Rangers or Houston Astros to clinch.
Both Texas and Houston lost, leaving the Guardians with a magic number of one to make the playoffs. That's the same as the Chicago White Sox. If both win on Thursday, they both will earn a postseason berth.
Cleveland, which had a six-game winning streak snapped on Wednesday, has a one-game lead over Chicago in the race for the AL Central title, and the White Sox own the division tiebreaker.
"We know we control our own destiny still," Guardians manager Stephen Vogt said. "So, I like where we are. We've got four games left, and we have a chance to get in. That's all you can ask for."
Vogt's lineup managed five singles on Wednesday, including two by leadoff hitter Steven Kwan, who has hits in 13 of his past 15 games, with a .373 average over that span.
The Guardians entered the series without a scheduled starter for Thursday, but Vogt determined that Daniel Espino (0-0, 4.73 ERA) will open before Joey Cantillo (10-9, 3.74) pitches in a bulk role.
That combination was used in a 5-3 win over the Athletics last Friday, with Espino allowing three runs in the first inning and Cantillo firing six shutout, two-hit frames.
"The biggest difference is that you don't have as much time to get ready," Cantillo said of the difference between being a starter and reliever.
Cantillo is 1-0 with a 3.38 ERA in eight career innings against the Red Sox, and Espino has not faced them.
--Field Level Media
Cleveland's Injuries| Player | POS | Status | Date | Note |
|---|---|---|---|---|
| C. Holderman | RP | Fifteen Day IL - Wrist( Sep 03, '26) | Sep 03, '26 | |
| The Cleveland Guardians placed Colin Holderman (RP) on the 15-day injured list with right wrist inflammation. | ||||
| R. Hoskins | 1B | Ten Day IL - Back( Aug 18, '26) | Aug 18, '26 | |
| The Cleveland Guardians placed INF Rhys Hoskins on the 10-day injured list due to lower back inflammation. | ||||
Boston's Injuries| Player | POS | Status | Date | Note |
|---|---|---|---|---|
| J. Slaten | RP | Sixty Day IL - Elbow( Sep 28, '26) | Sep 28, '26 | |
| The Boston Red Sox transferred RHP Justin Slaten from the 15-day injured list to the 60-day injured list due to right elbow inflammation. | ||||
| M. Gasper | DH | Ten Day IL - Biceps( Sep 26, '26) | Sep 26, '26 | |
| The Boston Red Sox placed DH Mickey Gasper on the 10-day injured list due to a right biceps strain. | ||||
| T. Guerrero | RP | Fifteen Day IL - Shoulder( Sep 26, '26) | Sep 26, '26 | |
| The Boston Red Sox placed RP Tyron Guerrero on the 15-day injured list due to a right shoulder strain. | ||||
| E. White | CF | Sixty Day IL - Foot( Sep 26, '26) | Sep 26, '26 | |
| The Boston Red Sox placed CF Eli White on the 60-day injured list with a right foot ligament injury. | ||||
| A. Seigler | 2B | Ten Day IL - Wrist( Sep 12, '26) | Sep 12, '26 | |
| The Boston Red Sox placed Anthony Seigler (2B) on the 10-day injured list due to right wrist inflammation. | ||||
| E. Rivera | SP | Sixty Day IL - Back( Aug 31, '26) | Aug 31, '26 | |
| The Boston Red Sox placed LHP Eduardo Rivera on the 60-day injured list with a lumbar strain. | ||||
| M. Yoshida | DH | Ten Day IL - Hamstring( Aug 15, '26) | Aug 15, '26 | |
| The Boston Red Sox placed DH Masataka Yoshida on the 10-day injured list due to a hamstring injury. | ||||
| C. Mead | 3B | Ten Day IL - Hand( Jul 28, '26) | Jul 28, '26 | |
| The Boston Red Sox placed INF Curtis Mead on the 10-day injured list due to left wrist fracture. | ||||
| Z. Kelly | RP | Sixty Day IL - Elbow( Jul 20, '26) | Jul 20, '26 | |
| The Boston Red Sox placed RHP Zack Kelly on the 60-day injured list with right elbow inflammation. | ||||
| K. Crawford | SP | Sixty Day IL - Wrist( May 21, '26) | May 21, '26 | |
| The Boston Red Sox transferred RHP Kutter Crawford from the 15-day injured list to the 60-day injured list as he recovers from right wrist surgery. | ||||
| T. Casas | 1B | Sixty Day IL - Knee( Apr 21, '26) | Apr 21, '26 | |
| The Boston Red Sox transferred INF Triston Casas from the 10-day injured list to the 60-day injured list as he recovers from left patellar tendon repair. | ||||
| J. Oviedo | SP | Sixty Day IL - Elbow( Apr 13, '26) | Apr 13, '26 | |
| The Boston Red Sox transferred RHP Johan Oviedo to the 60-day injured list due to a right elbow strain. | ||||
2026
Jersey Number 0
Games Officiated 31
Home Team W/L 15-16
Home Avg. Margin -0.10
Home Money Total -375
| Umpire | G | W-L | AVG | PIT | STR | B | STR% | STR | BB | K/BB | HR | O/U |
|---|---|---|---|---|---|---|---|---|---|---|---|---|
| Quinn Wolcott | 31 | 15-16 | 8.23 | 293.68 | 187.97 | 105.71 | 64.0 | 17.5 | 6.2 | 2.81 | 2.03 | 15-16 |
Game Stats | |
|---|---|
| Average | 8.23 |
| Starters Runs | 4.42 |
| BullPens Runs | 3.81 |
| Pitches | 293.7 |
| Strikes | 188.0 |
| Balls | 105.7 |
| Strike% | 64.00 % |
| SO | 17.5 |
| Walks | 6.2 |
| SO/Walks | 2.81 |
| HR | 2.0 |
Home Favourite |
Home Underdog |
||
|---|---|---|---|
| -101 to -120 | 4 - 1 | 100 to 110 | 0 - 1 |
| -121 to -140 | 2 - 2 | 111 to 130 | 1 - 2 |
| -141 to -160 | 5 - 3 | 131 to 150 | 1 - 1 |
| -161 to -180 | 2 - 3 | 151 to 170 | 0 - 1 |
| -181 + | 0 - 2 | 171 + | 0 - 0 |
Total |
Over | Under |
|---|---|---|
| 7 or less | 2 | 2 |
| 7.5 | 3 | 5 |
| 8 | 4 | 1 |
| 8.5 | 2 | 6 |
| 9 | 1 | 1 |
| 9.5 | 2 | 1 |
| 10 | 0 | 0 |
| 10.5 | 0 | 0 |
| 11 | 1 | 0 |
| 11.5 | 0 | 0 |
| 12 | 0 | 0 |
| 12.5 | 0 | 0 |
| 13+ | 0 | 0 |
| Date | Score | Line | O/U | Road Starter | Home Starter |
|---|---|---|---|---|---|
| Sep 19, 2026 | NYM 10 - PHI 3 | W -125 | O 8.0 | Andrew Painter (R) | Christian Scott (R) |
| Sep 15, 2026 | CHC 3 - ATL 6 | L -144 | O 8.5 | Martin Perez (L) | Kevin Gausman (R) |
| Aug 29, 2026 | CLE 3 - KC 8 | L -158 | O 7.5 | Daniel Lynch IV (L) | Foster Griffin (L) |
| Aug 24, 2026 | DET 1 - TB 4 | L +126 | U 7.5 | Drew Rasmussen (R) | Framber Valdez (L) |
| Aug 20, 2026 | MIL 7 - SEA 4 | W -134 | O 8.0 | George Kirby (R) | Robert Gasser (L) |
| Aug 15, 2026 | LAA 1 - KC 0 | W -156 | U 7.5 | Randy Dobnak (R) | Reid Detmers (L) |
| Aug 10, 2026 | ATH 6 - TB 10 | L +142 | O 9.5 | Freddy Peralta (R) | Jacob Lopez (L) |
| Aug 6, 2026 | AZ 1 - SD 5 | L +100 | U 9.0 | Walker Buehler (R) | Kohl Drake (L) |
| Jul 26, 2026 | BOS 6 - TOR 1 | W -142 | U 7.5 | Kevin Gausman (R) | Ranger Suarez (L) |
| Jul 22, 2026 | NYY 3 - PIT 5 | L -200 | U 9.5 | Mitch Keller (R) | Gerrit Cole (R) |
| Date | Score | Line | O/U | Road Starter | Home Starter |
|---|---|---|---|---|---|
| Aug 29, 2026 | CLE 3 - KC 8 | L -158 | O 7.5 | Daniel Lynch IV (L) | Foster Griffin (L) |
| May 10, 2026 | CLE 4 - MIN 5 | L -162 | O 7.5 | Andrew Morris (R) | Gavin Williams (R) |
| Apr 25, 2026 | TOR 5 - CLE 3 | W -152 | O 7.0 | Joey Cantillo (L) | Kevin Gausman (R) |
| Apr 1, 2026 | LAD 1 - CLE 4 | L -290 | U 8.0 | Gavin Williams (R) | Yoshinobu Yamamoto (R) |
| Feb 26, 2026 | SEA 8 - CLE 7 | W -152 | O 10.5 | Joey Cantillo (L) | Bryce Miller (R) |
| Date | Score | Line | O/U | Road Starter | Home Starter |
|---|---|---|---|---|---|
| Jul 26, 2026 | BOS 6 - TOR 1 | W -142 | U 7.5 | Kevin Gausman (R) | Ranger Suarez (L) |
| Date | Score | Line | O/U | Road Starter | Home Starter |
|---|
| Date | Score | Line | O/U | Road Starter | Home Starter |
|---|---|---|---|---|---|
| Jul 26, 2026 | BOS 6 - TOR 1 | W -142 | U 7.5 | Kevin Gausman (R) | Ranger Suarez (L) |
|
Date
Score
|
Line | O/U | IP | H | R | ER | SO | BB | HR | PIT | P/IP | GB:FB |
|---|---|---|---|---|---|---|---|---|---|---|---|---|
|
Sep 18, '26
CLE 5 - ATH 3
|
W -246 | p8.0 | 1.0 | 1 | 3 | 3 | 1 | 3 | 1 | 27 | 27.0 | 1.0 |
|
Sep 12, '26
MIN 4 - CLE 3
|
L -109 | u8.5 | 2.0 | 1 | 0 | 0 | 2 | 0 | 0 | 26 | 13.0 | 0.0 |
| Last 2 Avg. | 1.1 | 1.0 | 1.5 | 1.5 | 1.5 | 1.5 | 0.5 | 26.5 | 20.0 | 0.5 |
|
Date
Score
|
Line | O/U | IP | H | R | ER | SO | BB | HR | PIT | P/IP | GB:FB |
|---|---|---|---|---|---|---|---|---|---|---|---|---|
| Daniel Espino has not played against BOS Red Sox. | ||||||||||||
Ranger Suarez (L)
Last 5
|
Date
Score
|
Line | O/U | IP | H | R | ER | SO | BB | HR | PIT | P/IP | GB:FB |
|---|---|---|---|---|---|---|---|---|---|---|---|---|
|
Sep 18, '26
TB 2 - BOS 4
|
W +114 | u7.0 | 5.2 | 3 | 1 | 1 | 5 | 5 | 0 | 98 | 17.3 | 2.5 |
|
Sep 12, '26
BOS 5 - KC 1
|
W -225 | u8.5 | 7.0 | 5 | 1 | 1 | 8 | 0 | 1 | 96 | 13.7 | 2.0 |
|
Sep 04, '26
BAL 0 - BOS 1
|
W -118 | u8.0 | 7.0 | 5 | 0 | 0 | 3 | 1 | 0 | 91 | 13.0 | 2.5 |
|
Aug 30, '26
NYY 16 - BOS 1
|
L -138 | o8.0 | 5.1 | 9 | 6 | 6 | 2 | 2 | 1 | 101 | 18.9 | 1.0 |
|
Aug 24, '26
MIA 2 - BOS 4
|
W -119 | u7.0 | 5.0 | 4 | 1 | 1 | 4 | 4 | 0 | 93 | 18.6 | 1.0 |
| Last 5 Avg. | 6.0 | 5.2 | 1.8 | 1.8 | 4.4 | 2.4 | 0.4 | 95.8 | 16.3 | 1.8 |
|
Date
Score
|
Line | O/U | IP | H | R | ER | SO | BB | HR | PIT | P/IP | GB:FB |
|---|---|---|---|---|---|---|---|---|---|---|---|---|
|
May 31, '26
CLE 4 - BOS 9
|
W -102 | o7.0 | 5.0 | 8 | 4 | 4 | 10 | 2 | 0 | 93 | 18.6 | 1.0 |
|
May 10, '25
CLE 1 - PHI 7
|
W -121 | p8.0 | 7.0 | 3 | 0 | 0 | 5 | 1 | 0 | 82 | 11.7 | 1.6 |
|
Jul 21, '23
CLE 6 - PHI 5
|
L -115 | o8.5 | 5.0 | 8 | 4 | 4 | 5 | 2 | 0 | 94 | 18.8 | 0.0 |
| Last 3 Avg. | 5.2 | 6.3 | 2.7 | 2.7 | 6.7 | 1.7 | 0.0 | 89.7 | 16.4 | 0.9 |

