

 Y. Cano
 D. Nunez


| Overall | After Win | After Loss | |
|---|---|---|---|
| Game 1 | 28-20 | 13-9 | 15-11 |
| Game 2 | 19-29 | 13-15 | 6-14 |
| Game 3 | 23-25 | 8-11 | 15-14 |
| Game 4 | 2-4 | 2-1 | 0-3 |
| Overall | After Win | After Loss | |
|---|---|---|---|
| Game 1 | 25-23 | 13-11 | 12-12 |
| Game 2 | 18-30 | 8-17 | 10-13 |
| Game 3 | 23-25 | 9-9 | 14-16 |
| Game 4 | 3-2 | 2-0 | 1-2 |

| Team | R | H | E | 1 | 2 | 3 | 4 | 5 | 6 | 7 | 8 | 9 |
|---|---|---|---|---|---|---|---|---|---|---|---|---|
 BAL
Baltimore |
2 | 9 | 0 | 0 | 1 | 0 | 0 | 0 | 0 | 0 | 1 | 0 |
 NYM
NY Mets |
1 | 6 | 1 | 0 | 0 | 0 | 1 | 0 | 0 | 0 | 0 | 0 |
| Team | ML | O/U (Margin) | ATS (Margin) |
|---|---|---|---|
|
BAL
Baltimore
|
+118 | 8.5o | +1.5 (2.5) |
|
NYM
NY Mets
|
-143 | 8.5u (5.5) | -1.5 |
| POS | AB | R | H | RBI | BB | SO | LOB | AVG | |
|---|---|---|---|---|---|---|---|---|---|
| D. Beavers | LF | 5 | 0 | 0 | 0 | 0 | 2 | 3 | .241 |
| P. Alonso | 1B | 3 | 0 | 0 | 0 | 1 | 1 | 1 | .268 |
| G. Henderson | SS | 4 | 1 | 1 | 1 | 0 | 1 | 1 | .223 |
| C. Mayo | 3B | 4 | 0 | 1 | 0 | 0 | 1 | 0 | .224 |
| J. Holliday | 2B | 4 | 1 | 2 | 0 | 0 | 0 | 1 | .229 |
| C. Encarnacion-Strand | DH | 4 | 0 | 1 | 0 | 0 | 2 | 2 | .262 |
| H. Kjerstad | RF | 4 | 0 | 2 | 1 | 0 | 2 | 2 | .250 |
| C. Cowser | CF | 4 | 0 | 2 | 0 | 0 | 1 | 2 | .218 |
| C. Narvaez | C | 1 | 0 | 0 | 0 | 0 | 1 | 0 | .104 |
| S. Basallo | PH -C | 2 | 0 | 0 | 0 | 0 | 1 | 3 | .224 |
| Totals | 35 | 2 | 9 | 2 | 1 | 12 | 15 | ||
Battling
Fielding
| POS | AB | R | H | RBI | BB | SO | LOB | AVG | |
|---|---|---|---|---|---|---|---|---|---|
| F. Lindor | SS | 4 | 0 | 0 | 0 | 1 | 2 | 1 | .230 |
| J. Soto | LF | 3 | 0 | 1 | 0 | 1 | 1 | 1 | .273 |
| B. Bichette | 3B | 4 | 0 | 0 | 0 | 0 | 1 | 3 | .261 |
| C. Benge | RF | 4 | 0 | 2 | 0 | 0 | 0 | 1 | .273 |
| J. Young | DH | 2 | 0 | 0 | 0 | 1 | 1 | 2 | .268 |
| M. Vientos | PH -DH | 1 | 0 | 0 | 0 | 0 | 1 | 1 | .214 |
| M. Semien | 2B | 4 | 0 | 1 | 0 | 0 | 0 | 3 | .219 |
| A. Ewing | CF | 3 | 1 | 1 | 1 | 1 | 0 | 1 | .251 |
| B. Baty | 1B | 3 | 0 | 0 | 0 | 1 | 1 | 0 | .228 |
| F. Alvarez | C | 4 | 0 | 1 | 0 | 0 | 1 | 3 | .231 |
| Totals | 32 | 1 | 6 | 1 | 5 | 8 | 16 | ||
Battling
Baserunning
Fielding
| IP | H | R | ER | BB | SO | HR | ERA | |
|---|---|---|---|---|---|---|---|---|
| B. Young | 5 .0 | 5 | 1 | 1 | 5 | 6 | 1 | 3.65 |
| J. Walker | 1 .2 | 0 | 0 | 0 | 0 | 1 | 0 | 1.69 |
| Y. Cano (W 3-3) | 0 .1 | 0 | 0 | 0 | 0 | 0 | 0 | 3.13 |
| G. Wolfram (H 13) | 1 .0 | 1 | 0 | 0 | 0 | 1 | 0 | 4.66 |
| R. Garcia (S 9) | 1 .0 | 0 | 0 | 0 | 0 | 0 | 0 | 2.97 |
| IP | H | R | ER | BB | SO | HR | ERA | |
|---|---|---|---|---|---|---|---|---|
| J. Tong | 6 .0 | 4 | 1 | 0 | 1 | 6 | 0 | 3.43 |
| J. Pintaro | 1 .0 | 1 | 0 | 0 | 0 | 2 | 0 | 4.03 |
| D. Nunez (L 1-1) | 1 .0 | 2 | 1 | 1 | 0 | 1 | 1 | 4.30 |
| K. Senga | 1 .0 | 2 | 0 | 0 | 0 | 3 | 0 | 7.02 |
Location Citi Field
Temperature 70° Temperature
Attendance 35,800 attendance
Home Dan Bellino
1st Mark Ripperger
2nd Shane Livensparger
3rd Dan Merzel
| Date | Home | Result | ML | O/U | BAL Starter (IP) | NYM Starter (IP) |
|---|---|---|---|---|---|---|
| Jul 10, '25 | BAL |
7 - 3
|
BAL +108 | u10.5 | T. Sugano (6.0) | B. Waddell (3.0) |
| Jul 10, '25 | BAL |
3 - 1
|
BAL +122 | u9.5 | C. Morton (6.0) | D. Peterson (7.0) |
| Jul 08, '25 | BAL |
7 - 6
|
NYM -124 | o10.0 | B. Young (5.1) | C. Holmes (5.0) |
| Aug 21, '24 | NYM |
4 - 3
|
NYM -138 | u8.5 | C. Irvin (4.1) | S. Manaea (7.0) |
| Aug 20, '24 | NYM |
9 - 5
|
BAL +117 | o8.5 | D. Kremer (6.0) | J. Quintana (5.0) |
| Aug 19, '24 | NYM |
4 - 3
|
NYM -134 | u9.0 | T. Rogers (4.2) | D. Peterson (7.0) |
| Aug 06, '23 | BAL |
2 - 0
|
BAL -193 | u9.0 | K. Bradish (4.2) | J. Quintana (6.0) |
| Aug 05, '23 | BAL |
7 - 3
|
BAL -168 | o9.5 | K. Gibson (7.0) | T. Megill (4.2) |
| Aug 04, '23 | BAL |
10 - 3
|
BAL -140 | o9.5 | D. Kremer (5.1) | D. Peterson (3.0) |
| Jun 09, '21 | BAL |
14 - 1
|
NYM -130 | o9.5 | M. Harvey (3.0) | T. Walker (7.0) |
Last Meeting ( Jul 10, 2025 ) NY Mets 3, Baltimore 7
Pete Alonso will be in a familiar position Monday when he enters Citi Field in New York on the doorstep of a milestone home run.
He will just be wearing an unfamiliar uniform.
Alonso will look to make his first visit to Citi Field as an opposing player a historic one Monday, when he and the Baltimore Orioles take on the New York Mets in the opener of a three-game interleague series.
Brandon Young (9-4, 3.71 ERA) is slated to start for the Orioles against the Mets' Jonah Tong (2-1, 4.80) in a battle of right-handers.
Both teams lost the rubber game of a three-game road series on Sunday. The Orioles were routed by the Toronto Blue Jays 8-1 while the Mets fell to the New York Yankees 2-0.
Alonso, who hit his 299th career homer in Saturday's 7-3 loss, didn't go deep Sunday. But he reached another milestone by collecting his American League-best 100th RBI with a fifth-inning single.
In his first season with Baltimore after spending his career with the Mets, Alonso leads the majors with five 100-RBI seasons since his 2019 debut in New York, though San Francisco's Rafael Devers is two RBIs shy of his fifth 100 RBI campaign in that span.
The first baseman also is fourth in the AL with 35 homers -- the seventh time he's recorded at least 30 homers in a season since 2019, tied for the most in the big leagues with Philadelphia's Kyle Schwarber.
Alonso has produced those power numbers while also playing in a major league-leading 1,158 games since 2019. But despite the durability and consistency, the Mets never made Alonso a formal offer when he reached free agency following last season. The slugger signed a five-year deal with the Orioles in December for a reported $155 million.
"Both the Orioles as an organization and myself, I feel like we align and fit perfectly," Alonso said when the Orioles visited the New York Yankees at Yankee Stadium on May 1. "When you have something good, you focus on it."
The playoff hopes for Alonso and the Orioles (72-78) grew dimmer with Sunday's loss, which dropped them four games behind the Cleveland Guardians (76-74) in the race for the third and final AL wild-card spot. Both teams have 12 games remaining.
"We can moan and groan and complain about where we're at, but we dug ourselves this hole," Orioles pitcher Trevor Rogers said. "We have to dig ourselves out of it."
The Mets (69-80) never dug themselves out of the hole they created during a 12-game losing streak in April. New York will officially be eliminated from playoff contention with one more loss or one more win by the Arizona Diamondbacks.
But the Mets have thrived in the role of spoiler since the trade deadline, when they raised the white flag by dealing seven veterans. New York is 22-14 since Aug. 3, a span in which it has won series against the contending Guardians, San Diego Padres, Tampa Bay Rays and Miami Marlins.
The Mets were positioned to take the Subway Series against the playoff-bound Yankees after rookie Zac Thornton gave up two runs over seven innings in Saturday's 12-2 win. Second-year right-hander Christian Scott gave up the two runs in six innings Sunday, but his effort went for naught as the visitors were limited to three hits by Cam Schlittler and a trio of relievers.
"I don't see playoff atmospheres rattling those guys," Mets interim manager Andy Green said. "Those guys are wired to handle that stuff."
New York shortstop Francisco Lindor, a former longtime teammate of Alonso, will also enter the series with 299 homers. Lindor hit two homers, including a grand slam, in Saturday's rout.
Young took the defeat in his most recent start last Tuesday, when he allowed six runs over 3 2/3 innings in the Orioles' 9-5 home loss to the Guardians. Tong last pitched Sept. 7, when he earned the win after giving up four runs over five innings in the Mets' 9-4 victory over the host Marlins.
Young didn't factor into the decision in his lone previous start against the Mets on July 8, 2025, when he allowed two runs over 5 1/3 innings in the Orioles' 7-6, 10-inning home loss. Tong has never opposed Baltimore.
--Field Level Media
Baltimore's Injuries| Player | POS | Status | Date | Note |
|---|---|---|---|---|
| K. Bradish | SP | Sixty Day IL - Lower Abdominal( Sep 23, '26) | Sep 23, '26 | |
| The Baltimore Orioles placed SP Kyle Bradish on the 60-day injured list due to lower abdominal discomfort. | ||||
| S. Basallo | C | Seven Day IL - Concussion( Sep 22, '26) | Sep 22, '26 | |
| The Baltimore Orioles placed Samuel Basallo (C) on the 7-day injured list due to Concussion. | ||||
| T. O'Neill | RF | Sixty Day IL - Shoulder( Sep 18, '26) | Sep 18, '26 | |
| The Baltimore Orioles transferred RF Tyler O'Neill to the 60-day injured list. | ||||
| J. Holliday | 2B | Ten Day IL - Wrist( Sep 15, '26) | Sep 15, '26 | |
| The Baltimore Orioles placed Jackson Holliday (2B) on the 10-day injured list due to left wrist inflammation. | ||||
| B. Alexander | 3B | Ten Day IL - Back( Sep 08, '26) | Sep 08, '26 | |
| The Baltimore Orioles placed Blaze Alexander (3B) on the 10-day injured list with a low back discomfort. | ||||
| L. Robert Jr. | CF | Ten Day IL - Hamstring( Sep 05, '26) | Sep 05, '26 | |
| The Baltimore Orioles placed Luis Robert (CF) on the 10-day injured list due to left hamstring discomfort. | ||||
| R. Mountcastle | 1B | Sixty Day IL - Foot( Jul 30, '26) | Jul 30, '26 | |
| The Baltimore Orioles said on Friday (Jul. 31) that INF Ryan Mountcastle pulled an oblique earlier this week and will now miss a couple more months. | ||||
| K. Akin | RP | Sixty Day IL - Elbow( Jul 12, '26) | Jul 12, '26 | |
| The Baltimore Orioles transferred LHP Keegan Akin from the 15-day injured list to the 60-day injured list due to left elbow discomfort. | ||||
| R. Helsley | RP | Sixty Day IL - Elbow( Jul 02, '26) | Jul 02, '26 | |
| The Baltimore Orioles transferred RHP Ryan Helsley to the 60-day injured list. | ||||
| Z. Eflin | SP | Sixty Day IL - Elbow( Apr 06, '26) | Apr 06, '26 | |
| The Baltimore Orioles transferred RHP Zach Eflin from the 15-day injured list to the 60-day injured list with right elbow discomfort. | ||||
| J. Westburg | 3B | Sixty Day IL - UCL( Mar 31, '26) | Mar 31, '26 | |
| Westburg will miss the remainder of the 2026 season according to Andy Kostka of The Baltimore Banner. | ||||
| C. Selby | SP | Sixty Day IL - Shoulder( Feb 13, '26) | Feb 13, '26 | |
| The Baltimore Orioles placed RHP Colin Selby on the 60-day injured list due to right shoulder inflammation. | ||||
New York's Injuries| Player | POS | Status | Date | Note |
|---|---|---|---|---|
| J. Pintaro | SP | Fifteen Day IL - Illness( Sep 26, '26) | Sep 26, '26 | |
| The New York Mets placed SP Jonathan Pintaro on the 15-day injured list. | ||||
| C. Scott | SP | Fifteen Day IL - Knee( Sep 21, '26) | Sep 21, '26 | |
| The New York Mets placed SP Christian Scott on the 15-day injured list with left knee inflammation. | ||||
| J. Young | 1B | Seven Day IL - Head( Sep 17, '26) | Sep 17, '26 | |
| The New York Mets placed Jared Young (1B) on the 7-day injured list due to concussion. | ||||
| R. Stock | RP | Fifteen Day IL - Fingers( Sep 15, '26) | Sep 15, '26 | |
| The New York Mets placed RP Robert Stock on the 15-day injured list due to numbness in his fingers. | ||||
| D. Duarte | RP | Fifteen Day IL - Hamstring( Sep 15, '26) | Sep 15, '26 | |
| The New York Mets placed Daniel Duarte (RP) on the 15-day injured list with a left hamstring strain. | ||||
| J. Polanco | DH | Sixty Day IL - Ankle( Aug 18, '26) | Aug 18, '26 | |
| The New York Mets transferred DH Jorge Polanco to the 60-day injured list with left ankle bursitis. | ||||
| T. Megill | SP | Sixty Day IL - Elbow( Feb 11, '26) | Feb 11, '26 | |
| The New York Mets placed RHP Tylor Megill on the 60-day injured list due to an elbow injury. | ||||
| R. Garrett | RP | Sixty Day IL - Elbow( Feb 09, '26) | Feb 09, '26 | |
| The New York Mets placed RHP Reed Garrett on the 60-day injured list due to right elbow inflammation. | ||||
2026
Jersey Number 0
Games Officiated 36
Home Team W/L 18-18
Home Avg. Margin -0.56
Home Money Total -131
| Umpire | G | W-L | AVG | PIT | STR | B | STR% | STR | BB | K/BB | HR | O/U |
|---|---|---|---|---|---|---|---|---|---|---|---|---|
| Dan Bellino | 36 | 18-18 | 7.94 | 291.39 | 186.44 | 104.94 | 64.0 | 16.7 | 5.7 | 2.91 | 2.22 | 12-22 |
Game Stats | |
|---|---|
| Average | 7.94 |
| Starters Runs | 4.61 |
| BullPens Runs | 3.33 |
| Pitches | 291.4 |
| Strikes | 186.4 |
| Balls | 104.9 |
| Strike% | 63.98 % |
| SO | 16.7 |
| Walks | 5.7 |
| SO/Walks | 2.91 |
| HR | 2.2 |
Home Favourite |
Home Underdog |
||
|---|---|---|---|
| -101 to -120 | 1 - 3 | 100 to 110 | 4 - 2 |
| -121 to -140 | 4 - 2 | 111 to 130 | 2 - 2 |
| -141 to -160 | 3 - 5 | 131 to 150 | 1 - 1 |
| -161 to -180 | 2 - 3 | 151 to 170 | 0 - 0 |
| -181 + | 0 - 0 | 171 + | 1 - 0 |
Total |
Over | Under |
|---|---|---|
| 7 or less | 0 | 2 |
| 7.5 | 5 | 5 |
| 8 | 3 | 1 |
| 8.5 | 2 | 9 |
| 9 | 1 | 3 |
| 9.5 | 0 | 1 |
| 10 | 0 | 1 |
| 10.5 | 1 | 0 |
| 11 | 0 | 0 |
| 11.5 | 0 | 0 |
| 12 | 0 | 0 |
| 12.5 | 0 | 0 |
| 13+ | 0 | 0 |
| Date | Score | Line | O/U | Road Starter | Home Starter |
|---|---|---|---|---|---|
| Sep 3, 2026 | HOU 6 - CHW 2 | W -157 | U 8.5 | Luis Castillo (R) | Hunter Brown (R) |
| Aug 30, 2026 | LAA 2 - PHI 5 | L +150 | U 7.5 | Zack Wheeler (R) | Yusei Kikuchi (L) |
| Aug 25, 2026 | SD 0 - PIT 1 | L -130 | U 7.5 | Paul Skenes (R) | Michael King (R) |
| Aug 21, 2026 | AZ 9 - CIN 0 | W -147 | O 8.5 | Nick Lodolo (L) | Eduardo Rodriguez (L) |
| Aug 9, 2026 | NYY 1 - ATL 2 | L -141 | U 8.5 | Grant Holmes (R) | Cam Schlittler (R) |
| Aug 5, 2026 | BAL 5 - LAA 2 | W -132 | U 8.0 | Reid Detmers (L) | Trevor Rogers (L) |
| Jul 31, 2026 | CIN 8 - PIT 7 | W +110 | O 7.5 | Paul Skenes (R) | Hunter Greene (R) |
| Jul 27, 2026 | MIA 8 - PHI 7 | W +172 | O 7.5 | Zack Wheeler (R) | Tyler Phillips (R) |
| Jul 22, 2026 | LAA 0 - STL 1 | L -142 | U 8.5 | Hunter Dobbins (R) | Reid Detmers (L) |
| Jul 18, 2026 | SEA 4 - SF 3 | W -158 | P 7.0 | Logan Webb (R) | Bryan Woo (R) |
| Date | Score | Line | O/U | Road Starter | Home Starter |
|---|---|---|---|---|---|
| Aug 5, 2026 | BAL 5 - LAA 2 | W -132 | U 8.0 | Reid Detmers (L) | Trevor Rogers (L) |
| Date | Score | Line | O/U | Road Starter | Home Starter |
|---|
| Date | Score | Line | O/U | Road Starter | Home Starter |
|---|
| Date | Score | Line | O/U | Road Starter | Home Starter |
|---|
 Brandon Young (R)
Last 5
|
Date
Score
|
Line | O/U | IP | H | R | ER | SO | BB | HR | PIT | P/IP | GB:FB |
|---|---|---|---|---|---|---|---|---|---|---|---|---|
|
Sep 08, '26
BAL 5 - CLE 9
|
L -125 | o8.0 | 3.2 | 8 | 6 | 6 | 2 | 2 | 1 | 86 | 23.5 | 1.0 |
|
Sep 03, '26
BAL 5 - BOS 6
|
L +100 | o8.5 | 6.2 | 4 | 3 | 3 | 7 | 2 | 2 | 98 | 14.7 | 1.3 |
|
Aug 28, '26
ATH 3 - BAL 4
|
W -108 | u9.5 | 7.0 | 5 | 1 | 1 | 4 | 1 | 1 | 91 | 13.0 | 1.7 |
|
Aug 22, '26
BAL 3 - TB 2
|
W +116 | u8.5 | 5.2 | 6 | 2 | 2 | 3 | 3 | 1 | 84 | 14.8 | 0.0 |
|
Aug 17, '26
TB 7 - BAL 6
|
L +148 | o7.5 | 4.0 | 8 | 4 | 4 | 3 | 1 | 3 | 82 | 20.5 | 2.0 |
| Last 5 Avg. | 5.1 | 6.2 | 3.2 | 3.2 | 3.8 | 1.8 | 1.6 | 88.2 | 17.3 | 1.2 |
|
Date
Score
|
Line | O/U | IP | H | R | ER | SO | BB | HR | PIT | P/IP | GB:FB |
|---|---|---|---|---|---|---|---|---|---|---|---|---|
|
Jul 08, '25
BAL 6 - NYM 7
|
L +106 | o10.0 | 5.1 | 5 | 2 | 2 | 6 | 0 | 1 | 66 | 12.4 | 1.0 |
| Last 1 Avg. | 5.1 | 5.0 | 2.0 | 2.0 | 6.0 | 0.0 | 1.0 | 66.0 | 12.4 | 1.0 |
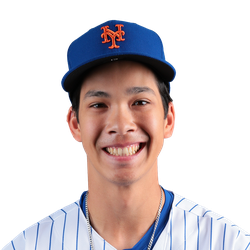 Jonah Tong (R)
Last 5
|
Date
Score
|
Line | O/U | IP | H | R | ER | SO | BB | HR | PIT | P/IP | GB:FB |
|---|---|---|---|---|---|---|---|---|---|---|---|---|
|
Sep 07, '26
MIA 4 - NYM 9
|
W +117 | o8.5 | 5.0 | 4 | 4 | 4 | 7 | 1 | 1 | 87 | 17.4 | 0.5 |
|
Sep 24, '25
CHC 10 - NYM 3
|
L +102 | o7.0 | 2.0 | 7 | 5 | 5 | 1 | 2 | 0 | 56 | 28.0 | 1.0 |
|
Sep 18, '25
NYM 6 - SD 1
|
W -132 | u9.0 | 5.0 | 4 | 1 | 0 | 8 | 0 | 0 | 82 | 16.4 | 0.3 |
|
Sep 12, '25
NYM 3 - TEX 8
|
L -108 | o7.5 | 0.2 | 4 | 6 | 6 | 1 | 3 | 0 | 40 | 60.0 | 0.0 |
|
Sep 06, '25
CIN 6 - NYM 3
|
L -128 | p9.0 | 6.0 | 3 | 4 | 4 | 6 | 4 | 3 | 96 | 16.0 | 1.3 |
| Last 5 Avg. | 3.2 | 4.4 | 4.0 | 3.8 | 4.6 | 2.0 | 0.8 | 72.2 | 27.6 | 0.6 |
|
Date
Score
|
Line | O/U | IP | H | R | ER | SO | BB | HR | PIT | P/IP | GB:FB |
|---|---|---|---|---|---|---|---|---|---|---|---|---|
| Jonah Tong has not played against BAL Orioles. | ||||||||||||


