MLB
05/29/2026
12:23 ET
Get free expert and computer MLB picks for every game on May 29, 2026. With over 25 years of betting experience, our analysts and predictive models help you find the best value.

Great American Ball Park is always a strong place to target home runs, and Mike Yastrzemski is one of the better +EV dinger looks on the board today with a fair price around +480, per the projections at Covers powered by THE BAT. He’s in strong form right now with the team’s third-best slugging percentage and wOBA over the last 30 days, while also getting the ball in the air consistently with a 52% fly-ball rate that ranks second on the team this month. He’ll face Chris Paddack, who has been crushed at GABP this year with a 12.67 ERA and a 2.2 HR/9. His 35% groundball rate does him no favors in this park, and his bottom-10 xFIP among MLB starters over the last 30 days suggests the struggles are very real. Pitcher-vs.-hitter history is usually secondary, but it’s still worth noting that Yastrzemski has had success against Paddack with three home runs across 25 plate appearances.

Brandon Lowe is in a prime spot tonight against right-hander Taj Bradley, who has struggled to keep left-handed hitters from elevating the baseball. Over Bradley’s last 60 lefty matchups, opponents have produced a 22.2% barrel rate and 58.3% fly ball rate. Lowe has also been crushing right-handed pitching lately, posting a 60% hard-hit rate, 20% barrel rate, and 55% fly ball rate across his last 30 matchups. With strong arsenal coverage against Bradley’s pitch mix and elite historical HRR trends, Lowe’s Over 1.5 Hits, Runs, RBI looks extremely attractive.
These are two tantalizing starters: Taj Bradley has a 108 Stuff+, whereas Jared Jones hits 100 mph on the radar gun and had a 3.18 botERA last we saw him in 2024. The main concern is the weather (hot, wind blowing out), but that's mitigated at PNC park (second-lowest park factor for home runs).

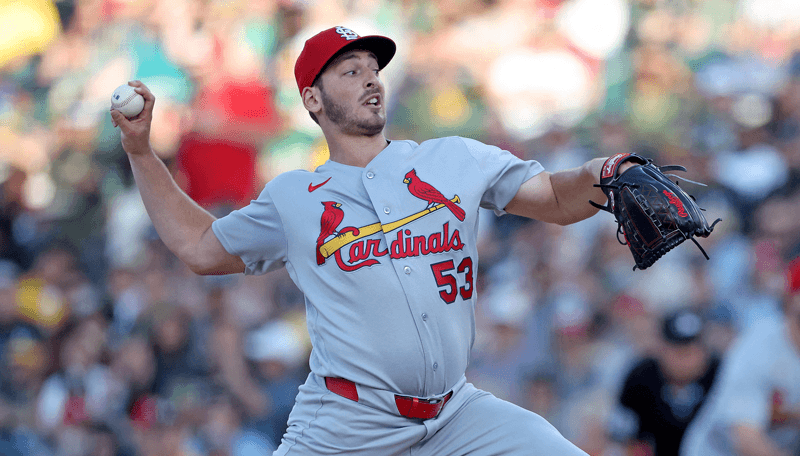
I’ll continue fading Rogers by taking the Over on his earned runs total of 2.5. He’s eclipsed this total in six straight starts, and the Toronto Blue Jays should victimize him again as a strong-hitting team against the fastball. Rogers owns just a 22% strikeout rate and is averaging just 2.5 K’s per game over his last four starts. Give me Vlad Guerrero Jr to go Under 0.5 strikeouts tonight. He’s seeing the ball well and has struck out just once in his last seven outings.
Vladimir Guerrero Jr. is in a prime spot Friday night against Trevor Rogers and the Baltimore Orioles. The Toronto Blue Jays slugger enters with an elite Batters-Box rating and has consistently produced in these spots away from home, recording 2+ bases in 50% of elite road matchups. Guerrero also owns the highest arsenal coverage among elite-rated hitters on today’s slate, matching up extremely well against Rogers’ pitch mix.

Max Meyer dominated the Mets last weekend, tossing seven scoreless innings with eight strikeouts while allowing just one hit. Miami has won eight of the last 10 meetings and covered the run line in three of the last four. Meyer has gone Over his strikeout prop in three straight starts and faces a Mets lineup striking out frequently.
Max Meyer and Freddy Peralta have been dominant in the first inning all season, making this a strong NRFI spot. Meyer owns a 9-2 NRFI record and has limited the Mets to a .094 average, while Peralta hasn't allowed a first-inning run in 10 straight starts. Both offenses also struggle to score early.

Chicago scored 17 in winning the last two in Pittsburgh, but neither team has been hitting it well this month. After entering the month in the Top 5 in batting, the Cubs rank 14th in MLB at the plate in May.
Their OPS of .652 is down 128 points, and they’re batting 11% below league average in May. St. Louis is two spots lower in the May rankings and has dropped 61 points in OPS. They’re also 8% under the league average.
The St. Louis Cardinals are underdogs despite being the home team and being better over the last 10. Two of the last three times St. Louis has allowed fewer than five runs came in Andre Pallante starts.
His improved pitch mix has paid dividends. In an even matchup with a more reliable starter, I’d take St. Louis and its plus-money odds.
The Royals have won six of their last seven meetings with the Rangers and turn to Stephen Kolek, who is coming off a complete-game shutout. Kolek owns a 2.77 ERA and has stayed Under 5.5 hits allowed in every start. With MacKenzie Gore also pitching well, the Under is appealing.
Offense has been hard to find for both Kansas City and Texas lately, which supports another NRFI play. Stephen Kolek has yet to allow a first-inning run this season, while MacKenzie Gore owns an 8-3 NRFI record. With both lineups struggling early, a scoreless first inning is likely.
Rafael Devers is in an elite spot tonight against Michael Lorenzen at Coors Field, but instead of laying juice on traditional props like total bases or HRR, there is more value attacking his ceiling outcome. Rather than paying steep prices for safer markets, sprinkling on Devers to record a double and a home run offers far better upside at plus money. If Devers is going to do damage in this matchup, the expectation is that it comes in loud fashion. Coors Field only adds to that potential, and when a home run just misses, it often turns into a double off the wall anyway.
Rafael Devers is in an elite spot tonight against Michael Lorenzen at Coors Field, but instead of laying juice on traditional props like total bases or HRR, there is more value attacking his ceiling outcome. Rather than paying steep prices for safer markets, sprinkling on Devers to record a double and a home run offers far better upside at plus money. If Devers is going to do damage in this matchup, the expectation is that it comes in loud fashion. Coors Field only adds to that potential, and when a home run just misses, it often turns into a double off the wall anyway.

New York has a strong path to crooked innings, and the A's aren't a dead offense against left-handed pitching. While Rodon’s contact profile is excellent, his 18.6% walk rate creates risk against an Athletics lineup with plenty of pop. Severino is the bigger trigger. His high walk rate is also a risk factor in this matchup. I project the Yankees to drive the total, and the As to do enough to get this over. I'd play this to -130.
When you’re cold, it’s never a bad idea to take the most probable home run on the slate today at a projection of 0.39 HR from New York’s Aaron Judge. With an implied 0.33 HR from the +246 price, it grades out as a +EV spot for a Judge homer. This is also the second-best home run park on the slate, per Ballpark Pal, and the matchup is favorable for the right-handed slugger, who ranks as THE BAT’s No. 1 hitter in baseball. Luis Severino has struggled significantly at Sutter Health Park, where his ERA is roughly two runs higher than his season average and was three runs higher there last year. His 2.2 HR/9 at home is among the worst marks in baseball, and he has already allowed multiple home runs in three of his four home starts this season. Judge also has history in the matchup, going 4-for-8 with a home run and four RBIs across eight at-bats against Severino.

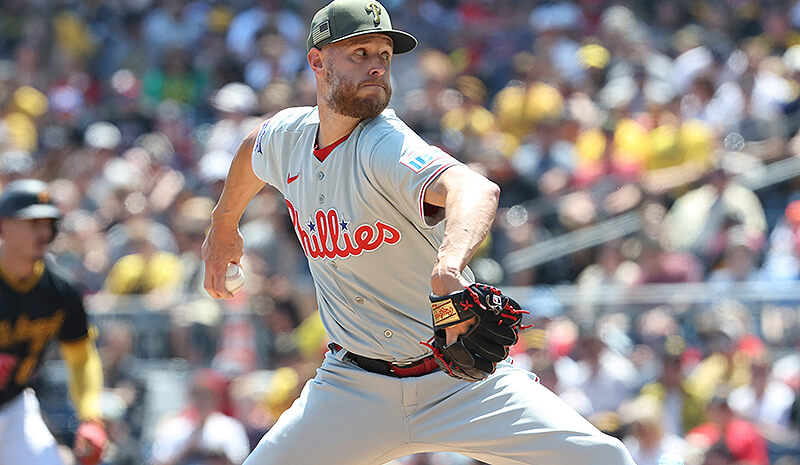
This is pretty simple for me: if you’re going to give me an edge on the Philadelphia Phillies with Zack Wheeler on the mound, I’m hitting the button without hesitation. The Phillies are trading as +104 underdogs on the moneyline, but I actually price them closer to -115 favorites in this spot. The Los Angeles Dodgers feature a veteran lineup that thrives by working counts, drawing walks, and waiting for mistakes they can drive into the gaps or out of the park. That approach becomes much less effective against Wheeler. Wheeler owns a 1.91 BB/9 this season and rarely gives hitters free baserunners. He’s a veteran ace who knows how to force lineups like the Dodgers to earn everything while still pitching efficiently deep into games.
This spot makes for an appealing Under as both bullpens are fully rested following Thursday’s off day. Philadelphia, which has ace Zack Wheeler on the bump, has a 2.00 SIERA and 28.9 K-BB% in relief over the last 20 days. LA holds a 2.94 FIP in that span.

Drew Rasmussen vs. the New York Yankees is a mismatch on paper — the righty is 4-1 with a 1.03 ERA and 51 punchouts in eight career games against New York. Coming off a thrilling comeback win on Friday, the division-leading Tampa Bay Rays are primed to keep the foot on the gas behind their dynamic arm to create more separation in the AL East.
Covers’ has more than 25 years of experience making smart MLB picks from the season’s first pitch to the World Series.
We find the best MLB odds and share our picks and baseball best bets for all the significant games of the baseball season right here on this page.
Our picks are researched and analyzed by experienced sports bettors looking for an edge to get the best value from their MLB betting.
Making smart MLB picks means looking beyond the favorites. Our free expert baseball picks will include a wide variety of bet types and markets.
Every day our baseball analysts look for quality baseball picks to share. You can expect well-researched picks on the money, run line, totals, player props, and much more.
Run lines are what other sports like football and basketball refer to as point spreads. Run lines even the odds between two teams, offering bettors as close to an even matchup as possible. Our analysts research vital stats, pitching matchups, injuries, and more to give you the best possible edge before making your MLB run line bets.
Covers’ analysts make MLB Over/Under picks throughout the baseball season. Betting on MLB Over/Unders means choosing whether you think the combined total runs scored in a game will be Over or Under a specific run total set by oddsmakers.
Betting on the MLB moneyline means picking which team will win a game outright. While less common than picking the run line or even a prop, our analysts will always look for high-value baseball moneyline picks if they feel it’s the best bet.
There’s always value in MLB props. Our team scours through game, team, and player props to try and find opportunity and value. From strikeouts to home runs, expect well-researched MLB prop picks from Covers.
Covers’ consensus MLB picks show you the odds and predictions that our vibrant community of bettors and players are making. Try our picks on with our free MLB contests for a chance at prizes and more.
If you’re ready to bet on MLB picks, you first need to find the right sportsbook. The best MLB betting sites offer secure banking, best odds, bonuses, and reliable customer service.
Covers’ staff of sports betting fans also offers a wide array of free picks for the NFL, NBA, NHL, NCAA basketball, and NCAA football.
Covers’ MLB picks release on game day. Some significant matchups like playoff games release in the days leading up to the game.
Covers provides free MLB picks covering many markets, including run lines, totals, moneylines, player props, and more.
 Established in 1995,