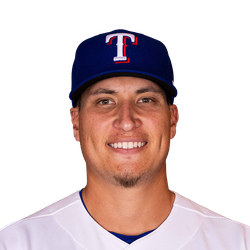
 R. Garcia






| Overall | After Win | After Loss | |
|---|---|---|---|
| Game 1 | 28-24 | 15-11 | 13-13 |
| Game 2 | 24-27 | 11-17 | 13-10 |
| Game 3 | 23-28 | 10-14 | 13-14 |
| Game 4 | 4-2 | 1-0 | 3-2 |
| Overall | After Win | After Loss | |
|---|---|---|---|
| Game 1 | 25-27 | 15-11 | 10-16 |
| Game 2 | 23-28 | 8-16 | 15-12 |
| Game 3 | 24-27 | 11-12 | 13-15 |
| Game 4 | 4-2 | 2-0 | 2-2 |

| Team | R | H | E | 1 | 2 | 3 | 4 | 5 | 6 | 7 | 8 | 9 |
|---|---|---|---|---|---|---|---|---|---|---|---|---|
 TEX
Texas |
6 | 13 | 0 | 0 | 4 | 0 | 1 | 1 | 0 | 0 | 0 | 0 |
 MIN
Minnesota |
2 | 8 | 1 | 1 | 0 | 0 | 0 | 0 | 0 | 0 | 1 | 0 |
| Team | ML | O/U (Margin) | ATS (Margin) |
|---|---|---|---|
|
TEX
Texas
|
-125 | 8o | -1.5 (2.5) |
|
MIN
Minnesota
|
+104 | 8u | +1.5 |
| POS | AB | R | H | RBI | BB | SO | LOB | AVG | |
|---|---|---|---|---|---|---|---|---|---|
| B. Nimmo | RF | 5 | 0 | 1 | 1 | 0 | 1 | 2 | .260 |
| M. Helman | RF | 0 | 0 | 0 | 0 | 0 | 0 | 0 | .167 |
| W. Langford | LF | 5 | 0 | 1 | 0 | 0 | 2 | 2 | .238 |
| C. Seager | SS | 5 | 0 | 1 | 0 | 0 | 1 | 0 | .226 |
| J. Burger | 1B | 5 | 1 | 1 | 1 | 0 | 2 | 0 | .230 |
| E. Duran | 3B -2B | 3 | 0 | 2 | 0 | 1 | 1 | 0 | .262 |
| N. Lopez | 2B | 2 | 1 | 1 | 0 | 0 | 0 | 1 | .274 |
| C. Freeman | 3B | 1 | 0 | 0 | 0 | 1 | 1 | 1 | .250 |
| D. Jansen | C | 4 | 2 | 2 | 2 | 0 | 2 | 3 | .201 |
| E. Carter | CF | 4 | 1 | 2 | 1 | 0 | 0 | 2 | .195 |
| A. Osuna | DH | 3 | 1 | 2 | 1 | 0 | 0 | 0 | .262 |
| J. Foscue | PH -DH | 1 | 0 | 0 | 0 | 0 | 1 | 1 | .272 |
| Totals | 38 | 6 | 13 | 6 | 2 | 11 | 12 | ||
Battling
Baserunning
Fielding
| POS | AB | R | H | RBI | BB | SO | LOB | AVG | |
|---|---|---|---|---|---|---|---|---|---|
| L. Keaschall | RF | 3 | 2 | 2 | 0 | 1 | 0 | 2 | .283 |
| B. Lee | 3B | 4 | 0 | 1 | 0 | 0 | 1 | 2 | .253 |
| K. Clemens | 2B | 4 | 0 | 1 | 1 | 0 | 0 | 3 | .239 |
| J. Bell | DH | 4 | 0 | 1 | 1 | 0 | 0 | 1 | .254 |
| W. Jenkins | CF | 4 | 0 | 0 | 0 | 0 | 1 | 2 | .213 |
| A. Roden | LF | 2 | 0 | 1 | 0 | 1 | 0 | 0 | .291 |
| A. Martin | PH | 1 | 0 | 0 | 0 | 0 | 1 | 0 | .231 |
| R. Lewis | 1B | 4 | 0 | 0 | 0 | 0 | 2 | 2 | .224 |
| V. Caratini | C | 4 | 0 | 1 | 0 | 0 | 2 | 1 | .220 |
| K. Culpepper | SS | 3 | 0 | 1 | 0 | 0 | 0 | 1 | .277 |
| Totals | 33 | 2 | 8 | 2 | 2 | 7 | 14 | ||
Battling
Fielding
| IP | H | R | ER | BB | SO | HR | ERA | |
|---|---|---|---|---|---|---|---|---|
| N. Eovaldi | 4 .1 | 4 | 1 | 1 | 2 | 3 | 0 | 4.20 |
| R. Garcia (W 2-1) | 1 .2 | 1 | 0 | 0 | 0 | 0 | 0 | 2.45 |
| J. Junis | 1 .0 | 1 | 0 | 0 | 0 | 0 | 0 | 3.50 |
| T. Alexander | 1 .0 | 2 | 1 | 1 | 0 | 1 | 0 | 3.63 |
| J. Latz | 1 .0 | 0 | 0 | 0 | 0 | 3 | 0 | 2.13 |
| IP | H | R | ER | BB | SO | HR | ERA | |
|---|---|---|---|---|---|---|---|---|
| B. Ober (L 7-7) | 5 .0 | 10 | 6 | 6 | 1 | 5 | 2 | 4.47 |
| T. Adams | 2 .0 | 2 | 0 | 0 | 1 | 4 | 0 | 4.58 |
| T. Rogers | 1 .0 | 1 | 0 | 0 | 0 | 1 | 0 | 4.33 |
| Y. Gomez | 1 .0 | 0 | 0 | 0 | 0 | 1 | 0 | 3.62 |
Location Target Field
Temperature 58° Temperature
Attendance 28,491 attendance
Home David Rackley
1st Nestor Ceja
2nd Charlie Ramos
3rd Chris Guccione
| Date | Home | Result | ML | O/U | TEX Starter (IP) | MIN Starter (IP) |
|---|---|---|---|---|---|---|
| Sep 25, '26 | MIN |
10 - 2
|
MIN +105 | o7.0 | J. deGrom (4.0) | J. Ryan (6.0) |
| Jun 18, '26 | TEX |
9 - 3
|
MIN -120 | o7.5 | J. Leiter (4.0) | J. Ryan (5.0) |
| Jun 16, '26 | TEX |
12 - 2
|
MIN +110 | o8.5 | K. Rocker (3.1) | Z. Matthews (7.0) |
| Jun 15, '26 | TEX |
4 - 2
|
MIN +130 | u8.5 | M. Gore (7.0) | M. Paredes (4.2) |
| Sep 25, '25 | TEX |
4 - 0
|
MIN +128 | u8.0 | T. Mahle (5.0) | B. Ober (6.0) |
| Sep 24, '25 | TEX |
4 - 2
|
TEX -170 | u7.0 | J. deGrom (5.0) | T. Bradley (6.0) |
| Sep 23, '25 | TEX |
4 - 1
|
MIN +126 | u8.0 | P. Corbin (3.2) | Z. Matthews (7.0) |
| Jun 12, '25 | MIN |
16 - 3
|
TEX +134 | o8.0 | P. Corbin (5.0) | B. Ober (4.2) |
| Jun 11, '25 | MIN |
6 - 2
|
MIN -152 | u8.5 | J. Leiter (4.0) | D. Festa (6.0) |
| Jun 10, '25 | MIN |
16 - 4
|
TEX +106 | o9.0 | T. Mahle (5.2) | S. Woods Richardson (4.2) |
Last Meeting ( Sep 25, 2026 ) Texas 2, Minnesota 10
The Texas Rangers have no time to dwell on their latest setback.
They still are tied with the Houston Astros for first place in the American League West. They still have a shot at reaching the postseason if they finish one game ahead of their in-state rivals.
Texas (79-81) will look to keep its postseason hopes alive when it squares off against the Minnesota Twins (76-84) on Saturday afternoon in Minneapolis. The Twins won the series opener 10-2, but the Rangers are determined to stay positive going forward.
"We have to," Rangers manager Skip Schumaker said. "That's the only way to do it. Two games left.
"... The important thing is to come back (Saturday) and do whatever we can to fight and to try to win that game. That's the most important game. Tough one (Friday), no doubt about it, but we have to figure out a way to keep going and stay positive and win."
Texas will need to do so without Josh Jung, who broke a bone in his hand after he was hit by a pitch Friday. Jung appeared in 104 games in a season interrupted by injuries.
Rangers right-hander Nathan Eovaldi (11-10, 4.27 ERA) is expected to take the mound on Saturday. He has 141 strikeouts in 141 1/3 innings this season and has appeared in 26 games, including 22 starts.
Eovaldi has not started a game since Aug. 7 against the Baltimore Orioles. He is searching for his first victory since July 25 against the Seattle Mariners.
In nine career starts against Minnesota, Eovaldi is 4-4 with a 4.75 ERA. This will be his first appearance against the Twins since 2024, when he allowed four runs (three earned) on six hits in seven innings and took the loss for the Rangers.
Twins right-hander Bailey Ober (7-6, 4.21) is set to make his 24th and final start of the season. He needs five more strikeouts to reach 700 for his career.
Ober is back in the rotation after serving a brief stint in the bullpen. In his last outing, he earned his first career save by pitching three scoreless innings to close out a victory over the Los Angeles Angels.
This will be Ober's sixth career start against Texas. He is 2-1 with a 5.61 ERA in his first five outings, and he has walked 14 and struck out 20 in 25 2/3 innings.
Ober has played his entire career for Minnesota. He has one year left on his contract, but he knows that change is possible during the offseason.
"I feel like there's always going to be options," Ober said. "Especially when we have eight starters. Guys like me, Joe (Ryan), Pablo (Lopez) and Dean (Kremer) will all be free agents the same year. And then you have a lot of young guys that have a lot of potential behind us.
"So there's always going to be chatter and thoughts. You never know if you're going to get moved. ... Obviously I'd love to stay here. But you never know. It's kind of up to the bigwigs up top to decide that."
-Field Level Media
Texas's Injuries| Player | POS | Status | Date | Note |
|---|---|---|---|---|
| J. Jung | 3B | Ten Day IL - Hand( Sep 25, '26) | Sep 25, '26 | |
| The Texas Rangers placed Josh Jung (3B) on the 10-day injured list. | ||||
| C. Quantrill | RP | Sixty Day IL - Lat( Sep 21, '26) | Sep 21, '26 | |
| The Texas Rangers placed RP Cal Quantrill on the 60-day injured list. | ||||
| J. Pederson | DH | Ten Day IL - Hand( Sep 21, '26) | Sep 21, '26 | |
| The Texas Rangers placed DH Joc Pederson on the 10-day injured list. | ||||
| M. Otanez | RP | Fifteen Day IL - Illness( Sep 18, '26) | Sep 18, '26 | |
| The Texas Rangers placed Michel Otañez (RP) on the 15-day injured list due to viral illness. | ||||
| C. Winn | RP | Sixty Day IL - Shoulder( Aug 30, '26) | Aug 30, '26 | |
| The Texas Rangers placed RP Cole Winn on the 60-day injured list due to right rotator cuff strain. | ||||
| J. Leiter | SP | Sixty Day IL - Ankle( Aug 08, '26) | Aug 08, '26 | |
| The Texas Rangers transferred RHP Jack Leiter from the 15-day injured list to the 60-day injured list due to ankle injury. | ||||
| K. Higashioka | C | Ten Day IL - Flexor Tendon( Jul 20, '26) | Jul 20, '26 | |
| The Texas Rangers placed C Kyle Higashioka on the 10-day injured list due to right flexor strain. | ||||
| J. Corniell | SP | Fifteen Day IL - Elbow( Jul 20, '26) | Jul 20, '26 | |
| The Texas Rangers transferred RHP Jose Corniell from the 15-day injured list to the 60-day injured list. | ||||
| J. Beeks | RP | Sixty Day IL - Back( Jul 20, '26) | Jul 20, '26 | |
| The Texas Rangers transferred LHP Jalen Beeks to the 60-day injured list with a low back spasm. | ||||
| C. Baumler | RP | Sixty Day IL - Ribs( May 22, '26) | May 22, '26 | |
| The Texas Rangers transferred RHP Carter Baumler to the 60-day injured list with right intercostal strain. | ||||
Minnesota's Injuries| Player | POS | Status | Date | Note |
|---|---|---|---|---|
| J. Hoffman | RP | Fifteen Day IL - Forearm( Sep 25, '26) | Sep 25, '26 | |
| The Minnesota Twins placed Jeff Hoffman (RP) on the 15-day injured list. | ||||
| T. Larnach | LF | Ten Day IL - Wrist( Sep 17, '26) | Sep 17, '26 | |
| The Minnesota Twins placed LF Trevor Larnach on the 10-day injured list due to left wrist sprain. | ||||
| B. Buxton | CF | Ten Day IL - Hip( Sep 10, '26) | Sep 10, '26 | |
| The Minnesota Twins placed OF Byron Buxton on the 10-day injured list with right hip impingement. | ||||
| M. Paredes | SP | Sixty Day IL - Oblique( Jul 31, '26) | Jul 31, '26 | |
| The Minnesota Twins transferred RHP Mike Paredes from the 15-day injured list to the 60-day injured list with a left oblique strain. | ||||
| C. Sands | RP | Sixty Day IL - Elbow( Jul 30, '26) | Jul 30, '26 | |
| The Minnesota Twins transferred RHP Cole Sands from the 15-day injured list to the 60-day injured list due to right elbow strain. | ||||
| A. Banda | RP | Sixty Day IL - Lat( Jul 10, '26) | Jul 10, '26 | |
| The Minnesota Twins transferred LHP Anthony Banda from the 15-day injured list to the 60-day injured list with a left lat strain. | ||||
| M. Abel | SP | Sixty Day IL - Elbow( Jul 09, '26) | Jul 09, '26 | |
| The Minnesota Twins transferred RHP Mick Abel from the 15-day injured list to the 60-day injured list with right elbow inflammation. | ||||
| D. Festa | SP | Sixty Day IL - Shoulder( Apr 02, '26) | Apr 02, '26 | |
| The Minnesota Twins transferred RHP David Festa from the 15-day injured list to the 60-day injured list due to right shoulder impingement, retroactive to March 22. | ||||
| P. Lopez | SP | Sixty Day IL - Elbow( Feb 25, '26) | Feb 25, '26 | |
| The Minnesota Twins placed RHP Pablo Lopez on the 60-day injured list following his successful UCL repair surgery with an internal brace. | ||||
2026
Jersey Number 0
Games Officiated 28
Home Team W/L 15-13
Home Avg. Margin 0.25
Home Money Total -69
| Umpire | G | W-L | AVG | PIT | STR | B | STR% | STR | BB | K/BB | HR | O/U |
|---|---|---|---|---|---|---|---|---|---|---|---|---|
| David Rackley | 28 | 15-13 | 9.11 | 297.00 | 190.39 | 106.61 | 64.1 | 16.8 | 5.7 | 2.94 | 2.29 | 12-15 |
Game Stats | |
|---|---|
| Average | 9.11 |
| Starters Runs | 5.29 |
| BullPens Runs | 3.82 |
| Pitches | 297.0 |
| Strikes | 190.4 |
| Balls | 106.6 |
| Strike% | 64.11 % |
| SO | 16.8 |
| Walks | 5.7 |
| SO/Walks | 2.94 |
| HR | 2.3 |
Home Favourite |
Home Underdog |
||
|---|---|---|---|
| -101 to -120 | 2 - 6 | 100 to 110 | 1 - 3 |
| -121 to -140 | 2 - 0 | 111 to 130 | 3 - 1 |
| -141 to -160 | 3 - 0 | 131 to 150 | 0 - 2 |
| -161 to -180 | 3 - 0 | 151 to 170 | 0 - 0 |
| -181 + | 1 - 1 | 171 + | 0 - 0 |
Total |
Over | Under |
|---|---|---|
| 7 or less | 3 | 1 |
| 7.5 | 3 | 1 |
| 8 | 0 | 3 |
| 8.5 | 4 | 6 |
| 9 | 1 | 0 |
| 9.5 | 0 | 1 |
| 10 | 0 | 0 |
| 10.5 | 0 | 0 |
| 11 | 0 | 2 |
| 11.5 | 0 | 0 |
| 12 | 0 | 0 |
| 12.5 | 0 | 1 |
| 13+ | 1 | 0 |
| Date | Score | Line | O/U | Road Starter | Home Starter |
|---|---|---|---|---|---|
| Sep 22, 2026 | COL 2 - AZ 7 | L +149 | U 11.0 | Michael Soroka (R) | Kyle Freeland (L) |
| Sep 15, 2026 | CLE 7 - CHW 6 | W -160 | O 9.0 | Chris Murphy (L) | Foster Griffin (L) |
| Sep 9, 2026 | BAL 9 - CLE 5 | W -102 | O 8.5 | Foster Griffin (L) | Shane Baz (R) |
| Sep 6, 2026 | NYM 4 - SF 2 | W -157 | U 8.0 | Cesar Perdomo (L) | Christian Scott (R) |
| Aug 30, 2026 | ATL 3 - COL 2 | W -235 | U 8.5 | Mason Adams (R) | Tyler Mahle (R) |
| Aug 25, 2026 | MIA 3 - BOS 7 | L +131 | O 7.0 | Payton Tolle (L) | Tyler Phillips (R) |
| Jul 24, 2026 | MIL 2 - COL 5 | L -290 | U 8.5 | Tomoyuki Sugano (R) | Shane Drohan (L) |
| Jul 20, 2026 | CLE 13 - MIN 4 | W +112 | O 7.5 | Joe Ryan (R) | Tanner Bibee (R) |
| Jul 12, 2026 | WAS 3 - NYY 5 | L -116 | U 9.5 | Will Warren (R) | Cade Cavalli (R) |
| Jul 8, 2026 | CHW 0 - BOS 5 | L -106 | U 8.0 | Jake Bennett (L) | Davis Martin (R) |
| Date | Score | Line | O/U | Road Starter | Home Starter |
|---|
| Date | Score | Line | O/U | Road Starter | Home Starter |
|---|---|---|---|---|---|
| Jul 20, 2026 | CLE 13 - MIN 4 | W +112 | O 7.5 | Joe Ryan (R) | Tanner Bibee (R) |
| Date | Score | Line | O/U | Road Starter | Home Starter |
|---|
| Date | Score | Line | O/U | Road Starter | Home Starter |
|---|
 Nathan Eovaldi (R)
Last 5
|
Date
Score
|
Line | O/U | IP | H | R | ER | SO | BB | HR | PIT | P/IP | GB:FB |
|---|---|---|---|---|---|---|---|---|---|---|---|---|
|
Aug 07, '26
TEX 2 - BAL 1
|
W -138 | u7.5 | 5.1 | 4 | 1 | 1 | 2 | 2 | 0 | 86 | 16.1 | 1.0 |
|
Jul 31, '26
HOU 11 - TEX 2
|
L +112 | o7.5 | 5.0 | 10 | 6 | 6 | 5 | 1 | 2 | 94 | 18.8 | 0.0 |
|
Jul 25, '26
TEX 7 - SEA 1
|
W -104 | o7.5 | 7.0 | 3 | 1 | 1 | 8 | 1 | 0 | 91 | 13.0 | 2.0 |
|
Jul 19, '26
ATL 8 - TEX 5
|
L -118 | o8.5 | 4.0 | 6 | 4 | 4 | 2 | 2 | 3 | 81 | 20.3 | 3.0 |
|
Jul 09, '26
TEX 7 - LAA 6
|
W -134 | o7.5 | 6.0 | 6 | 4 | 3 | 10 | 2 | 0 | 99 | 16.5 | 1.7 |
| Last 5 Avg. | 5.1 | 5.8 | 3.2 | 3.0 | 5.4 | 1.6 | 1.0 | 90.2 | 16.9 | 1.5 |
|
Date
Score
|
Line | O/U | IP | H | R | ER | SO | BB | HR | PIT | P/IP | GB:FB |
|---|---|---|---|---|---|---|---|---|---|---|---|---|
|
Aug 17, '24
TEX 2 - MIN 5
|
L -138 | u8.0 | 7.0 | 6 | 4 | 3 | 6 | 0 | 1 | 103 | 14.7 | 0.7 |
|
Apr 14, '21
MIN 2 - BOS 3
|
W +117 | u6.0 | 5.0 | 5 | 2 | 2 | 3 | 0 | 0 | 82 | 16.4 | 2.3 |
|
Sep 05, '19
BOS 1 - MIN 2
|
L -147 | u11.5 | 5.0 | 1 | 1 | 1 | 3 | 4 | 0 | 76 | 15.2 | 5.0 |
| Last 3 Avg. | 5.2 | 4.0 | 2.3 | 2.0 | 4.0 | 1.3 | 0.3 | 87.0 | 15.4 | 2.7 |
 Bailey Ober (R)
Last 5
|
Date
Score
|
Line | O/U | IP | H | R | ER | SO | BB | HR | PIT | P/IP | GB:FB |
|---|---|---|---|---|---|---|---|---|---|---|---|---|
|
Sep 15, '26
MIN 1 - NYY 8
|
L +142 | o7.5 | 5.1 | 9 | 3 | 3 | 3 | 2 | 1 | 101 | 18.9 | 0.4 |
|
Sep 06, '26
CHW 10 - MIN 1
|
L +120 | o8.5 | 4.1 | 4 | 1 | 1 | 6 | 3 | 0 | 84 | 19.4 | 1.0 |
|
Aug 29, '26
MIN 2 - CHW 3
|
L -104 | u9.0 | 5.0 | 2 | 2 | 1 | 5 | 2 | 0 | 80 | 16.0 | 2.3 |
|
Aug 23, '26
SD 8 - MIN 1
|
L +138 | p9.0 | 5.0 | 4 | 1 | 1 | 3 | 3 | 1 | 87 | 17.4 | 0.8 |
|
Aug 17, '26
MIN 4 - ATL 2
|
W +118 | u9.0 | 4.1 | 6 | 2 | 2 | 4 | 1 | 0 | 94 | 21.7 | 0.8 |
| Last 5 Avg. | 4.2 | 5.0 | 1.8 | 1.6 | 4.2 | 2.2 | 0.4 | 89.2 | 18.7 | 1.1 |
|
Date
Score
|
Line | O/U | IP | H | R | ER | SO | BB | HR | PIT | P/IP | GB:FB |
|---|---|---|---|---|---|---|---|---|---|---|---|---|
|
Sep 25, '25
TEX 0 - MIN 4
|
W +128 | u8.0 | 6.0 | 2 | 0 | 0 | 5 | 1 | 0 | 78 | 13.0 | 0.6 |
|
Jun 12, '25
MIN 3 - TEX 16
|
L -158 | o8.0 | 4.2 | 6 | 7 | 7 | 3 | 6 | 4 | 98 | 21.0 | 2.0 |
|
Aug 15, '24
TEX 2 - MIN 3
|
W -116 | u7.5 | 6.0 | 7 | 2 | 2 | 3 | 3 | 0 | 93 | 15.5 | 0.7 |
| Last 3 Avg. | 5.1 | 5.0 | 3.0 | 3.0 | 3.7 | 3.3 | 1.3 | 89.7 | 16.5 | 1.1 |