MLB
04/02/2026
09:55 ET
Get free expert and computer MLB picks for every game on April 2, 2026. With over 25 years of betting experience, our analysts and predictive models help you find the best value.

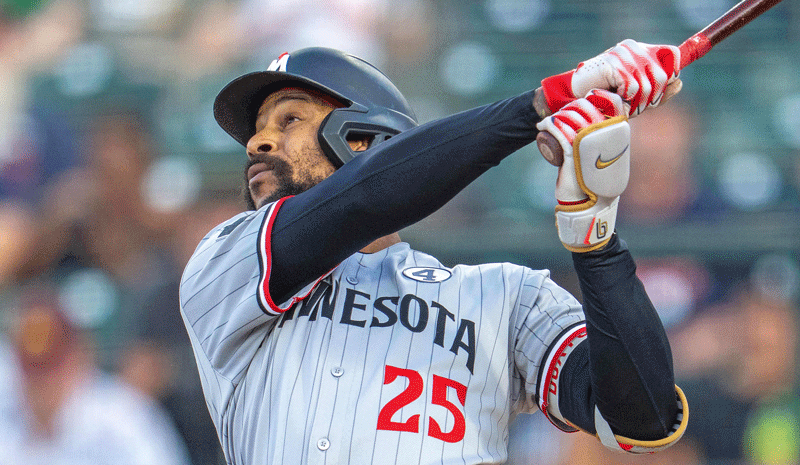
In addition to the wind forecasted to be howling out at Kauffman Stadium this afternoon, both Minnesota starter Taj Bradley and Kansas City lefty Cole Ragans struggled with control in their season debuts and combined for seven walks across 8 1/3 innings. Both lineups rank above average in on-base percentage to start the season, so runners on the basepaths with favorable hitting conditions is a recipe for runs on the board.
The Minnesota lineup paces the majors in hard-hit percentage while ranking sixth in exit velocity to start the year, so I’m anticipating statistical correction ahead of their middling, 18th-ranked BABIP. Plus, Kansas City starter Cole Ragans served up a 58.3% hard-hit rate in his season debut and has surrendered 17 earned runs across 20 innings dating back to spring training.

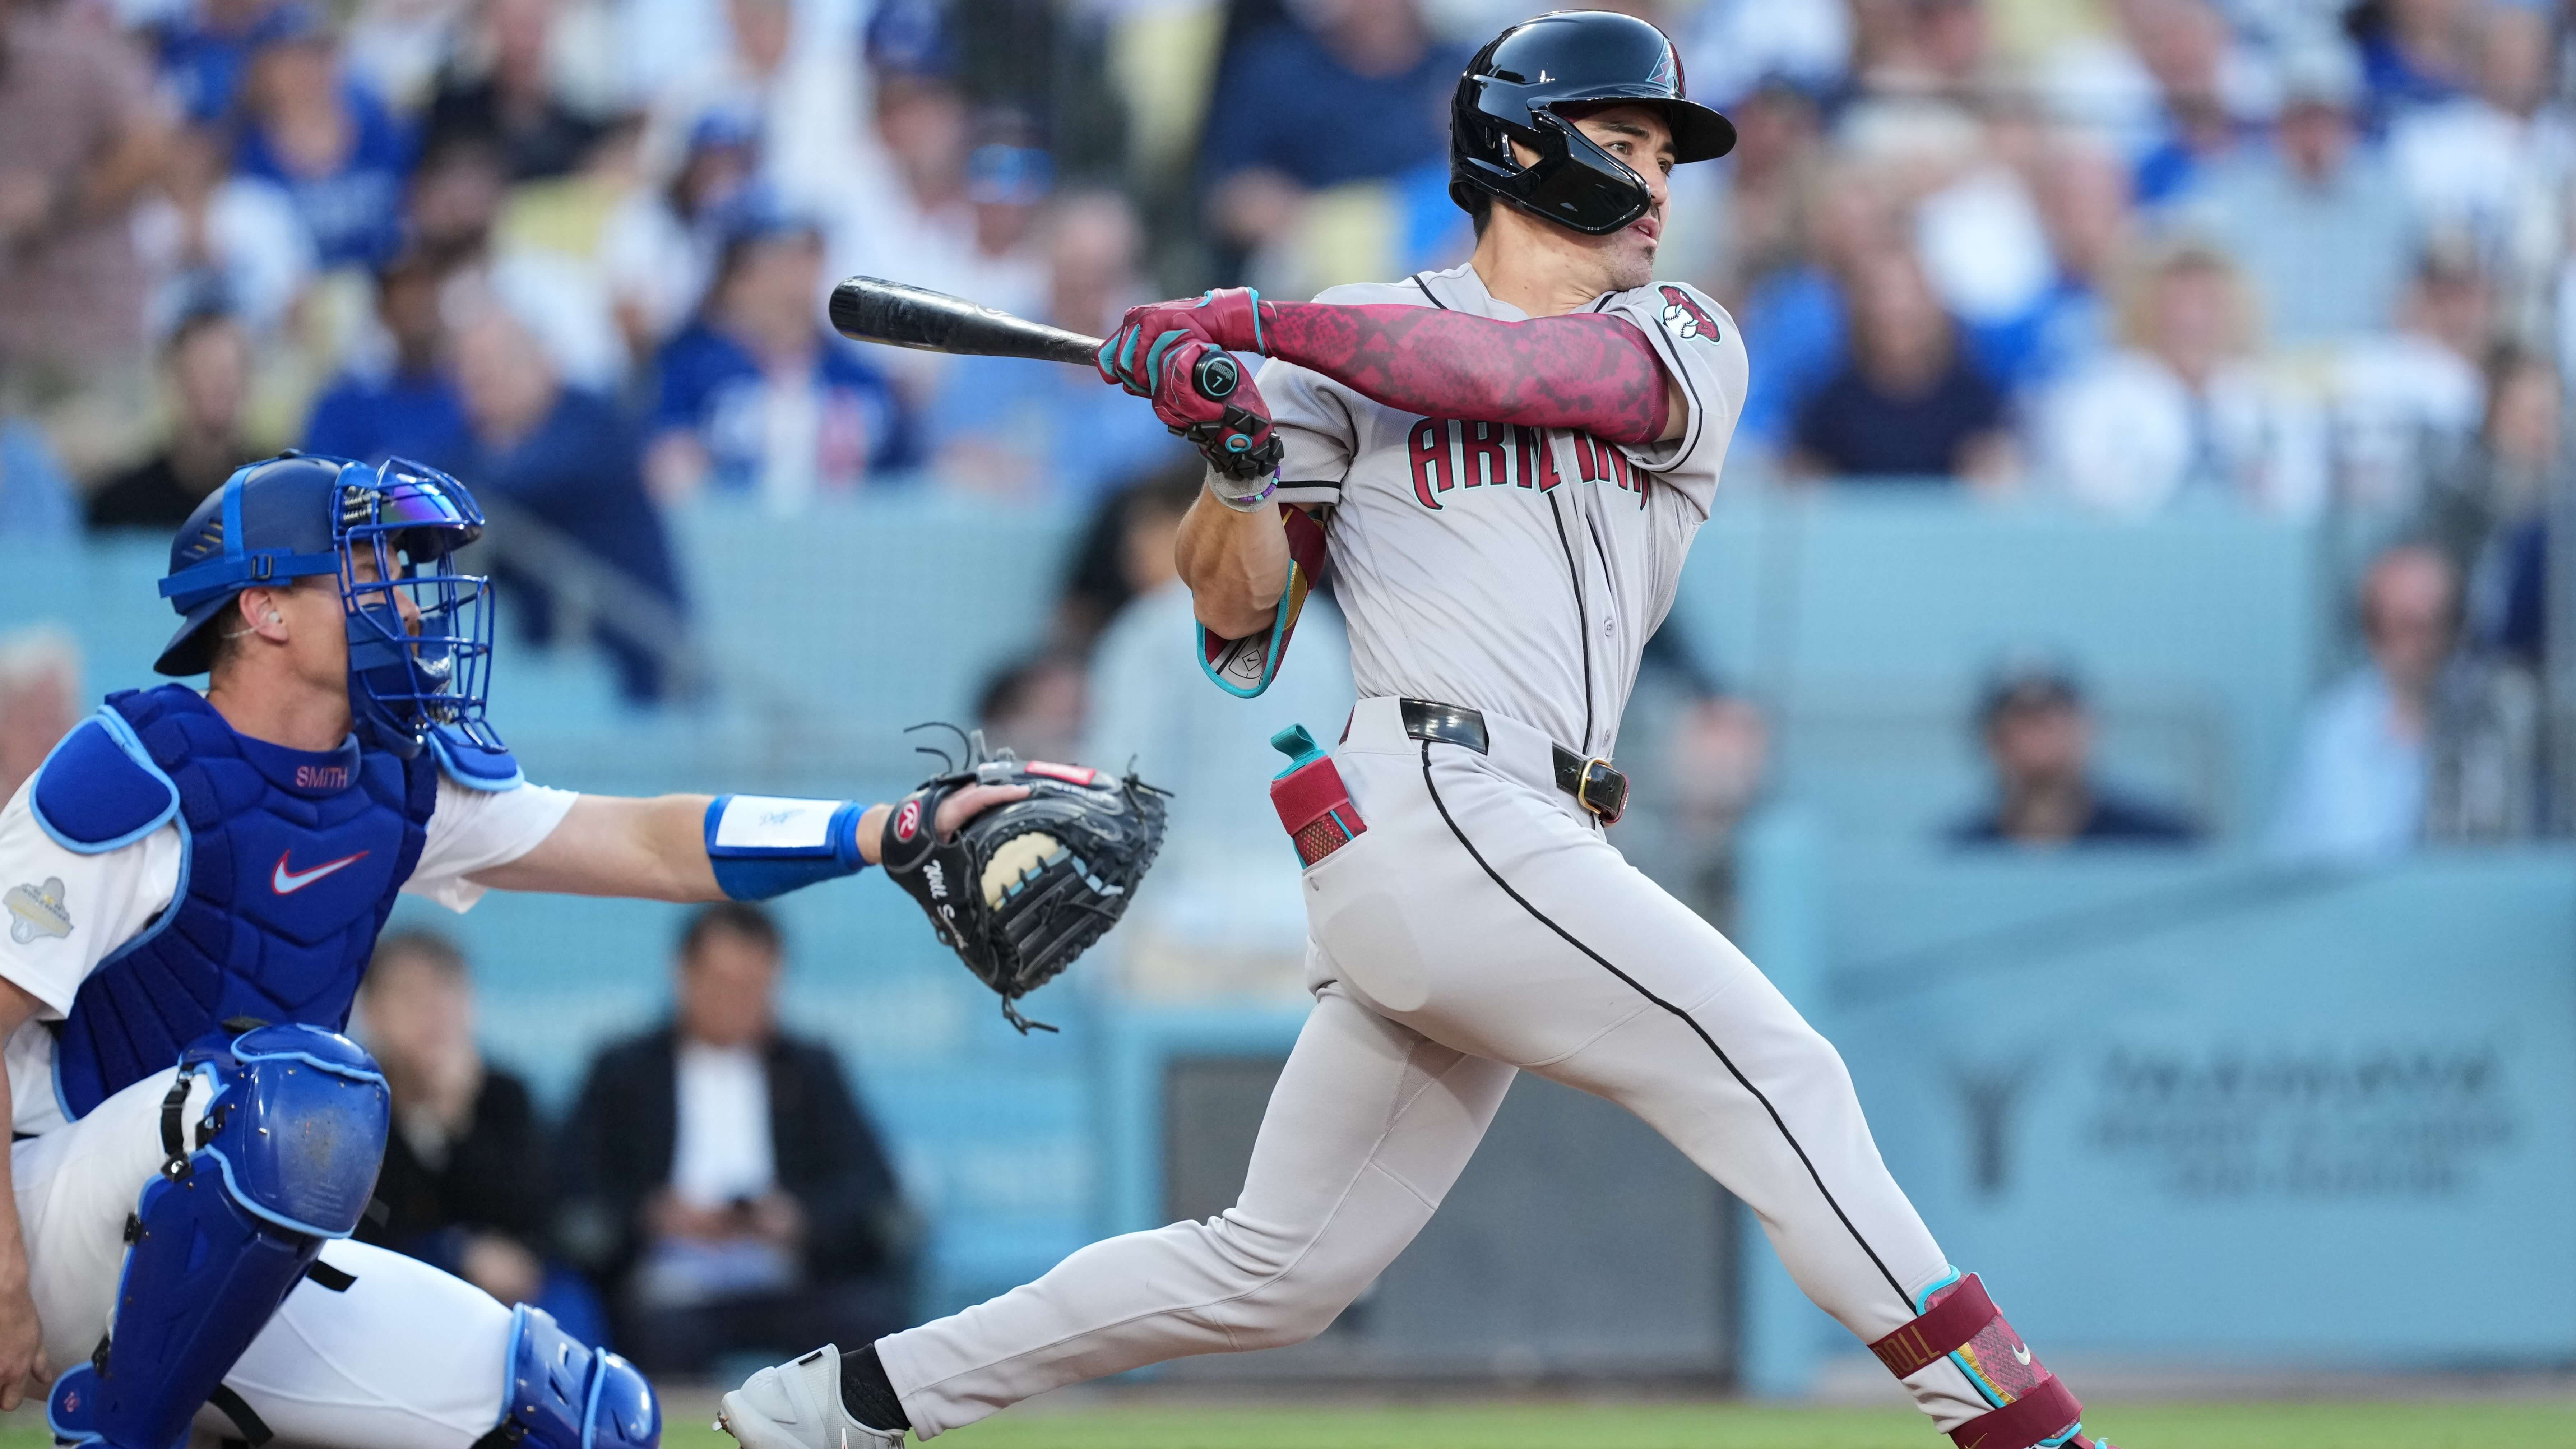
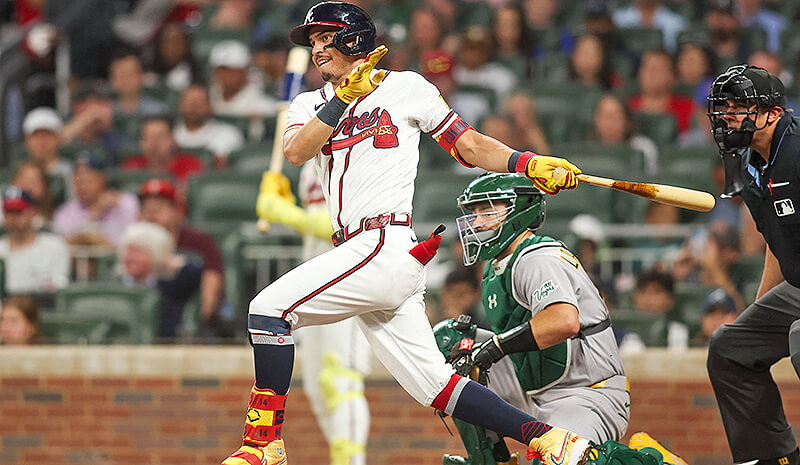
The Atlanta Braves are trading as a -113 favorite against the Arizona Diamondbacks, and I think this price is an absolute steal—I make the Braves closer to a -170 favorite in this matchup. Ryne Nelson allowed two home runs in his season debut, lasting just 4 2/3 innings, and his cutter could get him into trouble against a Braves lineup capable of barreling the ball consistently. What really stands out is the depth of Atlanta’s lineup right now. Mauricio Dubón and Dominic Smith are both hitting over .385 to start the season, helping turn the lineup over and giving a pitcher like Nelson nowhere to breathe. If the Braves can drive up his pitch count and get into the Diamondbacks’ bullpen early, it becomes a significant advantage for Atlanta.

Drake Baldwin is off to a strong start in his sophomore season, leading his team in multiple offensive categories and matching the rest of the lineup with three home runs entering Thursday. He’s slugging .773 with 60% hard-hit rate and hitting in the two-hole, already logging five plate appearances in two of his six games, which is more important than it might seem. He faces Ryne Nelson, who allowed two home runs in his season debut and relies heavily on contact to get outs — not an ideal profile against a hitter swinging this well. On a slate with limited late-game options, getting one of the hottest bats at +500 or better is an easy addition to the card.
Juan Soto is priced at +470 on FanDuel, offering a significant edge — roughly 100 points better than the market and about 70 points above fair value. The discount comes from the lefty-lefty matchup against Robbie Ray, but Soto has proven he can handle southpaws. The New York Mets' No. 2 hitter went deep yesterday and has recorded a hit in every game this season, showing strong early form. He also has some familiarity with Ray, with 10 career at-bats. It’s not the best power environment, but on a slate with limited late-game options, Soto at +425 or better is a clear add to the card.

Covers’ has more than 25 years of experience making smart MLB picks from the season’s first pitch to the World Series.
We find the best MLB odds and share our picks and baseball best bets for all the significant games of the baseball season right here on this page.
Our picks are researched and analyzed by experienced sports bettors looking for an edge to get the best value from their MLB betting.
Making smart MLB picks means looking beyond the favorites. Our free expert baseball picks will include a wide variety of bet types and markets.
Every day our baseball analysts look for quality baseball picks to share. You can expect well-researched picks on the money, run line, totals, player props, and much more.
Run lines are what other sports like football and basketball refer to as point spreads. Run lines even the odds between two teams, offering bettors as close to an even matchup as possible. Our analysts research vital stats, pitching matchups, injuries, and more to give you the best possible edge before making your MLB run line bets.
Covers’ analysts make MLB Over/Under picks throughout the baseball season. Betting on MLB Over/Unders means choosing whether you think the combined total runs scored in a game will be Over or Under a specific run total set by oddsmakers.
Betting on the MLB moneyline means picking which team will win a game outright. While less common than picking the run line or even a prop, our analysts will always look for high-value baseball moneyline picks if they feel it’s the best bet.
There’s always value in MLB props. Our team scours through game, team, and player props to try and find opportunity and value. From strikeouts to home runs, expect well-researched MLB prop picks from Covers.
Covers’ consensus MLB picks show you the odds and predictions that our vibrant community of bettors and players are making. Try our picks on with our free MLB contests for a chance at prizes and more.
If you’re ready to bet on MLB picks, you first need to find the right sportsbook. The best MLB betting sites offer secure banking, best odds, bonuses, and reliable customer service.
Covers’ staff of sports betting fans also offers a wide array of free picks for the NFL, NBA, NHL, NCAA basketball, and NCAA football.
Covers’ MLB picks release on game day. Some significant matchups like playoff games release in the days leading up to the game.
Covers provides free MLB picks covering many markets, including run lines, totals, moneylines, player props, and more.
 Established in 1995,