


| Overall | After Win | After Loss | |
|---|---|---|---|
| Game 1 | 26-25 | 13-11 | 13-14 |
| Game 2 | 20-31 | 9-17 | 11-14 |
| Game 3 | 24-27 | 10-10 | 14-17 |
| Game 4 | 3-3 | 2-1 | 1-2 |
| Overall | After Win | After Loss | |
|---|---|---|---|
| Game 1 | 23-28 | 9-13 | 14-15 |
| Game 2 | 27-24 | 11-12 | 16-12 |
| Game 3 | 22-27 | 14-13 | 8-14 |
| Game 4 | 3-5 | 0-2 | 3-3 |

| Team | R | H | E | 1 | 2 | 3 | 4 | 5 | 6 | 7 | 8 | 9 |
|---|---|---|---|---|---|---|---|---|---|---|---|---|
 NYM
NY Mets |
6 | 9 | 1 | 1 | 0 | 2 | 0 | 2 | 0 | 0 | 1 | 0 |
 WAS
Washington |
7 | 11 | 0 | 2 | 0 | 4 | 0 | 0 | 0 | 1 | 0 | 0 |
NY Mets Pitcher
 J. Pintaro
(L)
Washington Pitcher
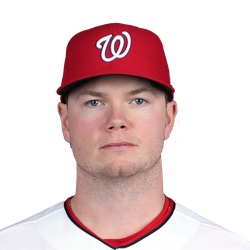 G. Varland
(W)
| Team | ML | O/U (Margin) | ATS (Margin) |
|---|---|---|---|
|
NYM
NY Mets
|
-108 | 8.5o (4.5) | -1.5 |
|
WAS
Washington
|
-112 | 8.5u | +1.5 (2.5) |
| POS | AB | R | H | RBI | BB | SO | LOB | AVG | |
|---|---|---|---|---|---|---|---|---|---|
| F. Lindor | SS | 5 | 1 | 1 | 0 | 0 | 2 | 0 | .224 |
| J. Soto | LF | 4 | 2 | 2 | 0 | 1 | 0 | 0 | .276 |
| B. Bichette | 3B | 4 | 1 | 2 | 2 | 1 | 1 | 1 | .261 |
| M. Vientos | DH | 2 | 0 | 1 | 2 | 0 | 1 | 0 | .216 |
| B. Baty | PH -DH | 1 | 1 | 1 | 0 | 0 | 0 | 0 | .240 |
| C. Benge | RF | 2 | 1 | 2 | 1 | 2 | 0 | 0 | .277 |
| F. Alvarez | C | 3 | 0 | 0 | 1 | 0 | 2 | 5 | .235 |
| M. Semien | 2B | 4 | 0 | 0 | 0 | 0 | 2 | 3 | .214 |
| A. Ewing | CF | 4 | 0 | 0 | 0 | 0 | 3 | 1 | .253 |
| C. Pache | CF | 0 | 0 | 0 | 0 | 0 | 0 | 0 | .125 |
| C. Morel | 1B | 4 | 0 | 0 | 0 | 0 | 1 | 0 | .200 |
| Totals | 33 | 6 | 9 | 6 | 4 | 12 | 10 | ||
Battling
Fielding
| POS | AB | R | H | RBI | BB | SO | LOB | AVG | |
|---|---|---|---|---|---|---|---|---|---|
| J. Wood | DH | 3 | 1 | 2 | 0 | 2 | 0 | 0 | .265 |
| A. Chaparro | 1B | 3 | 1 | 1 | 0 | 0 | 1 | 2 | .258 |
| A. Ortiz | PH -1B | 1 | 0 | 0 | 0 | 0 | 1 | 1 | .192 |
| Y. Morales | PH -1B | 1 | 0 | 0 | 0 | 0 | 1 | 0 | .273 |
| B. House | 3B | 3 | 1 | 1 | 0 | 1 | 1 | 1 | .245 |
| D. Crews | RF | 3 | 3 | 1 | 1 | 1 | 0 | 2 | .224 |
| C. Abrams | SS -2B | 3 | 1 | 1 | 2 | 1 | 0 | 0 | .263 |
| J. Young | CF | 4 | 0 | 2 | 0 | 0 | 0 | 3 | .252 |
| D. Lile | LF | 3 | 0 | 2 | 1 | 0 | 0 | 1 | .249 |
| K. Ruiz | C | 4 | 0 | 1 | 1 | 0 | 0 | 4 | .283 |
| J. Vivas | 2B | 4 | 0 | 0 | 0 | 0 | 0 | 2 | .239 |
| N. Nunez | SS | 0 | 0 | 0 | 0 | 0 | 0 | 0 | .209 |
| Totals | 32 | 7 | 11 | 5 | 5 | 4 | 16 | ||
Battling
Baserunning
Fielding
| IP | H | R | ER | BB | SO | HR | ERA | |
|---|---|---|---|---|---|---|---|---|
| J. Yan | 1 .2 | 3 | 2 | 2 | 2 | 1 | 0 | 4.87 |
| J. Pintaro (L 2-3) | 0 .1 | 2 | 3 | 3 | 1 | 0 | 0 | 5.28 |
| C. Perez | 1 .0 | 1 | 1 | 1 | 1 | 0 | 0 | 6.19 |
| J. Hagenman | 4 .0 | 5 | 1 | 1 | 1 | 2 | 1 | 3.38 |
| N. Lavender | 1 .0 | 0 | 0 | 0 | 0 | 1 | 0 | 1.74 |
| IP | H | R | ER | BB | SO | HR | ERA | |
|---|---|---|---|---|---|---|---|---|
| A. Alvarez | 4 .2 | 7 | 5 | 5 | 3 | 7 | 2 | 3.43 |
| G. Varland (W 2-2) | 1 .1 | 0 | 0 | 0 | 0 | 2 | 0 | 6.55 |
| Y. Cruz (H 3) | 1 .0 | 0 | 0 | 0 | 0 | 1 | 0 | 6.75 |
| J. Sinclair (H 4) | 1 .0 | 2 | 1 | 1 | 0 | 1 | 0 | 2.61 |
| J. Gray (S 1) | 1 .0 | 0 | 0 | 0 | 1 | 1 | 0 | 0.00 |
Location Nationals Park
Temperature 65° Temperature
Attendance 28,639 attendance
Home Sean Barber
1st Austin Jones
2nd Jen Pawol
3rd James Hoye
| Date | Home | Result | ML | O/U | NYM Starter (IP) | WAS Starter (IP) |
|---|---|---|---|---|---|---|
| Aug 16, '26 | NYM |
4 - 3
|
NYM -158 | u8.5 | C. Scott (6.1) | J. Irvin (6.0) |
| Aug 15, '26 | NYM |
5 - 4
|
NYM -135 | o7.5 | S. Manaea (6.1) | B. Lord (0.2) |
| Aug 14, '26 | NYM |
4 - 1
|
NYM -116 | u8.5 | R. Stock (4.1) | A. Alvarez (5.2) |
| May 21, '26 | WAS |
2 - 1
|
NYM -110 | u7.5 | D. Peterson (5.0) | C. Cavalli (7.0) |
| May 20, '26 | WAS |
8 - 4
|
WAS +110 | o9.5 | Z. Thornton (4.1) | Z. Littell (5.0) |
| May 19, '26 | WAS |
9 - 6
|
WAS +120 | o9.0 | N. McLean (5.2) | F. Griffin (5.0) |
| May 18, '26 | WAS |
16 - 7
|
NYM -126 | o10.0 | C. Scott (4.0) | J. Irvin (4.0) |
| Apr 30, '26 | NYM |
5 - 4
|
WAS +154 | o7.5 | F. Peralta (6.0) | M. Mikolas (4.0) |
| Apr 29, '26 | NYM |
14 - 2
|
WAS +136 | o7.0 | D. Peterson (3.2) | C. Cavalli (6.0) |
| Apr 28, '26 | NYM |
8 - 0
|
NYM -180 | P8.0 | C. Holmes (6.0) | Z. Littell (3.2) |
Last Meeting ( Aug 16, 2026 ) Washington 3, NY Mets 4
The New York Mets will try to end a disappointing season on a positive note when they visit the Washington Nationals for a three-game series beginning Friday night.
New York (73-86), which took two of three games from the Texas Rangers this week, would pass the Nationals (75-84) for fourth place in the National League East with a sweep this weekend. Losing the series would leave the Mets with their lowest full-season win total since they won 70 games in 2017.
Washington, meanwhile, already has its most wins since recording 93 in 2019.
CJ Abrams has 33 homers, James Wood has 30, and Daylen Lile has 22. And Cade Cavalli won't pitch again this season but has emerged as the team's ace, going 13-5 with a 3.02 ERA.
After a 4-2 win at the Detroit Tigers on Wednesday, Washington has won or tied its past four series.
"It's good to see a lot of progress, a lot to be excited about moving forward," Nationals manager Blake Butera said. "It makes you feel good about where you're heading."
The year has not been all bad for the Mets. Nolan McLean (12-10, 3.16 ERA) led a group of young pitchers -- including Zac Thornton, Christian Scott and Jonah Tong -- that enjoyed solid seasons.
"Every single one of them can pitch at least a rung further up the ladder than they're doing right now," Mets manager Andy Green said of the organization's young starters. "And that's great for us."
Rookie outfielders Carson Benge and A.J. Ewing have been impressive as everyday players, and Juan Soto enters the weekend with an outside shot at a fourth straight 30-homer season despite missing significant time due to injury.
The Mets have not yet named a starting pitcher for the series opener, while left-hander Andrew Alvarez (2-6, 3.17 ERA) will go for the Nationals.
Alvarez is 0-0 with a 1.16 ERA over his last four starts, allowing three runs in 23 1/3 innings and striking out 27 batters.
Against the St. Louis Cardinals on Saturday, he tossed six shutout innings in his team's 8-5, 11-inning victory. He tied his career high with eight strikeouts while walking one.
Alvarez lost to the Mets on Aug. 14 when he allowed two runs on two hits over 5 1/3 innings. He is 0-2 with a 5.54 ERA in three career appearances (two starts) vs. them.
On Thursday, the Mets fell 3-1 to the Texas Rangers. Thornton went five innings, allowing two runs on four hits while striking out four and walking one. The 24-year-old finished with a 3.42 ERA.
"I always thought I'd be up here this year; I didn't know to what extent it would be," Thornton said after his final start of the season. "I wouldn't say I surprised myself. I feel everywhere I've gone to pitch I've succeeded."
Against the Tigers on Wednesday, Washington's Nasim Nunez stole his 49th base of the season to set a Nationals (2005-present) team record.
"I'm not surprised, but I think the thing that I'm most proud of with Nas is how much he's grown on the bases by not forcing the envelope," Butera said.
Yohandy Morales hit a two-run homer and Abrams drove in his 103rd run of the season.
--Field Level Media
New York's Injuries| Player | POS | Status | Date | Note |
|---|---|---|---|---|
| J. Pintaro | SP | Fifteen Day IL - Illness( Sep 26, '26) | Sep 26, '26 | |
| The New York Mets placed SP Jonathan Pintaro on the 15-day injured list. | ||||
| C. Scott | SP | Fifteen Day IL - Knee( Sep 21, '26) | Sep 21, '26 | |
| The New York Mets placed SP Christian Scott on the 15-day injured list with left knee inflammation. | ||||
| J. Young | 1B | Seven Day IL - Head( Sep 17, '26) | Sep 17, '26 | |
| The New York Mets placed Jared Young (1B) on the 7-day injured list due to concussion. | ||||
| R. Stock | RP | Fifteen Day IL - Fingers( Sep 15, '26) | Sep 15, '26 | |
| The New York Mets placed RP Robert Stock on the 15-day injured list due to numbness in his fingers. | ||||
| D. Duarte | RP | Fifteen Day IL - Hamstring( Sep 15, '26) | Sep 15, '26 | |
| The New York Mets placed Daniel Duarte (RP) on the 15-day injured list with a left hamstring strain. | ||||
| J. Polanco | DH | Sixty Day IL - Ankle( Aug 18, '26) | Aug 18, '26 | |
| The New York Mets transferred DH Jorge Polanco to the 60-day injured list with left ankle bursitis. | ||||
| T. Megill | SP | Sixty Day IL - Elbow( Feb 11, '26) | Feb 11, '26 | |
| The New York Mets placed RHP Tylor Megill on the 60-day injured list due to an elbow injury. | ||||
| R. Garrett | RP | Sixty Day IL - Elbow( Feb 09, '26) | Feb 09, '26 | |
| The New York Mets placed RHP Reed Garrett on the 60-day injured list due to right elbow inflammation. | ||||
Washington's Injuries| Player | POS | Status | Date | Note |
|---|---|---|---|---|
| M. Waldron | SP | Sixty Day IL - Chest( Sep 11, '26) | Sep 11, '26 | |
| The Washington Nationals transfered SP Matt Waldron from the 15-day injured list to the 60-day injured list with chest inflammation. | ||||
| O. Ribalta | RP | Fifteen Day IL - Forearm( Sep 06, '26) | Sep 06, '26 | |
| The Washington Nationals placed Orlando Ribalta (RP) on the 15-day injured list due to right forearm inflammation. | ||||
| P. Poulin | RP | Sixty Day IL - Flexor( Aug 01, '26) | Aug 01, '26 | |
| The Washington Nationals transferred LHP PJ Poulin from the 15-day injured list to the 60-day injured list with a left flexor strain. | ||||
| D. Millas | C | Sixty Day IL - Finger( Jul 14, '26) | Jul 14, '26 | |
| The Washington Nationals transferred C Drew Millas to the 60-day injured list with a left index finger fracture. | ||||
| M. Parker | RP | Sixty Day IL - Elbow( Jun 30, '26) | Jun 30, '26 | |
| The Washington Nationals transferred LHP Mitchell Parker to the 60-day injured list from the 15-day injured list with elbow injury. | ||||
| K. Waldichuk | SP | Sixty Day IL - Forearm( Apr 15, '26) | Apr 15, '26 | |
| The Washington Nationals transferred LHP Ken Waldichuk from the 15-day injured list to the 60-day injured list with left forearm tightness. | ||||
2026
Jersey Number 0
Games Officiated 31
Home Team W/L 16-15
Home Avg. Margin 1.26
Home Money Total -130
| Umpire | G | W-L | AVG | PIT | STR | B | STR% | STR | BB | K/BB | HR | O/U |
|---|---|---|---|---|---|---|---|---|---|---|---|---|
| Sean Barber | 31 | 16-15 | 9.45 | 291.39 | 185.23 | 106.16 | 63.6 | 16.2 | 7.3 | 2.22 | 2.74 | 16-14 |
Game Stats | |
|---|---|
| Average | 9.45 |
| Starters Runs | 5.42 |
| BullPens Runs | 4.03 |
| Pitches | 291.4 |
| Strikes | 185.2 |
| Balls | 106.2 |
| Strike% | 63.57 % |
| SO | 16.2 |
| Walks | 7.3 |
| SO/Walks | 2.22 |
| HR | 2.7 |
Home Favourite |
Home Underdog |
||
|---|---|---|---|
| -101 to -120 | 4 - 5 | 100 to 110 | 0 - 2 |
| -121 to -140 | 4 - 2 | 111 to 130 | 3 - 1 |
| -141 to -160 | 1 - 2 | 131 to 150 | 1 - 0 |
| -161 to -180 | 1 - 1 | 151 to 170 | 0 - 0 |
| -181 + | 2 - 2 | 171 + | 0 - 0 |
Total |
Over | Under |
|---|---|---|
| 7 or less | 1 | 1 |
| 7.5 | 2 | 6 |
| 8 | 3 | 2 |
| 8.5 | 6 | 1 |
| 9 | 3 | 1 |
| 9.5 | 1 | 1 |
| 10 | 0 | 0 |
| 10.5 | 0 | 0 |
| 11 | 0 | 2 |
| 11.5 | 0 | 0 |
| 12 | 0 | 0 |
| 12.5 | 0 | 0 |
| 13+ | 0 | 0 |
| Date | Score | Line | O/U | Road Starter | Home Starter |
|---|---|---|---|---|---|
| Sep 22, 2026 | NYY 2 - TB 0 | W -145 | U 6.5 | Nick Martinez (R) | Carlos Rodon (L) |
| Sep 18, 2026 | CIN 6 - CHC 4 | W +124 | O 8.5 | Clay Holmes (R) | Chase Burns (R) |
| Sep 13, 2026 | MIN 2 - CLE 9 | L -126 | O 8.0 | Tanner Bibee (R) | Joe Ryan (R) |
| Sep 8, 2026 | SF 2 - STL 1 | W -110 | U 7.5 | Quinn Mathews (L) | Landen Roupp (R) |
| Sep 4, 2026 | SEA 6 - ATH 7 | L -250 | O 7.0 | Kade Morris (R) | Logan Gilbert (R) |
| Aug 31, 2026 | COL 1 - BAL 2 | L +112 | U 11.0 | Cade Povich (L) | Tanner Gordon (R) |
| Aug 20, 2026 | TB 1 - TOR 5 | L -161 | U 7.5 | Shane Bieber (R) | Ian Seymour (L) |
| Aug 15, 2026 | CIN 4 - MIA 8 | L -106 | O 9.0 | Ryan Gusto (R) | Brady Singer (R) |
| Aug 11, 2026 | DET 6 - CLE 4 | W -134 | O 9.5 | Tanner Bibee (R) | Drew Anderson (R) |
| Aug 6, 2026 | MIL 5 - PIT 2 | W -117 | U 7.5 | Braxton Ashcraft (R) | Dustin May (R) |
| Date | Score | Line | O/U | Road Starter | Home Starter |
|---|---|---|---|---|---|
| Jun 30, 2026 | TOR 0 - NYM 3 | L +100 | U 7.5 | Nolan McLean (R) | Kevin Gausman (R) |
| May 7, 2026 | COL 6 - NYM 2 | W +120 | U 11.0 | Christian Scott (R) | Jose Quintana (L) |
| Date | Score | Line | O/U | Road Starter | Home Starter |
|---|---|---|---|---|---|
| Apr 13, 2026 | PIT 16 - WAS 5 | W -225 | O 7.5 | Cade Cavalli (R) | Paul Skenes (R) |
| Date | Score | Line | O/U | Road Starter | Home Starter |
|---|
| Date | Score | Line | O/U | Road Starter | Home Starter |
|---|
|
Date
Score
|
Line | O/U | IP | H | R | ER | SO | BB | HR | PIT | P/IP | GB:FB |
|---|---|---|---|---|---|---|---|---|---|---|---|---|
| Jefry Yan has not played for NYM Mets. | ||||||||||||
|
Date
Score
|
Line | O/U | IP | H | R | ER | SO | BB | HR | PIT | P/IP | GB:FB |
|---|---|---|---|---|---|---|---|---|---|---|---|---|
| Jefry Yan has not played against WAS Nationals. | ||||||||||||
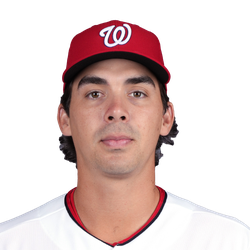 Andrew Alvarez (L)
Last 5
|
Date
Score
|
Line | O/U | IP | H | R | ER | SO | BB | HR | PIT | P/IP | GB:FB |
|---|---|---|---|---|---|---|---|---|---|---|---|---|
|
Sep 19, '26
STL 5 - WAS 8
|
W -104 | o9.0 | 6.0 | 5 | 0 | 0 | 8 | 1 | 0 | 92 | 15.3 | 6.0 |
|
Sep 12, '26
WAS 6 - LAA 5
|
W -132 | o8.5 | 7.0 | 1 | 0 | 0 | 8 | 4 | 0 | 97 | 13.9 | 3.0 |
|
Sep 06, '26
LAD 7 - WAS 5
|
L +159 | o8.5 | 4.1 | 4 | 3 | 3 | 5 | 2 | 0 | 78 | 18.0 | 1.0 |
|
Aug 30, '26
WAS 2 - MIA 6
|
L -126 | u9.5 | 6.0 | 2 | 0 | 0 | 6 | 3 | 0 | 97 | 16.2 | 7.0 |
|
Aug 25, '26
WAS 1 - COL 3
|
L -164 | u8.5 | 4.2 | 5 | 3 | 3 | 6 | 2 | 1 | 81 | 17.4 | 6.0 |
| Last 5 Avg. | 5.1 | 3.4 | 1.2 | 1.2 | 6.6 | 2.4 | 0.2 | 89.0 | 16.1 | 4.6 |
|
Date
Score
|
Line | O/U | IP | H | R | ER | SO | BB | HR | PIT | P/IP | GB:FB |
|---|---|---|---|---|---|---|---|---|---|---|---|---|
|
Aug 14, '26
NYM 4 - WAS 1
|
L +106 | u8.5 | 5.2 | 2 | 2 | 2 | 4 | 1 | 1 | 73 | 12.9 | 1.0 |
|
Sep 19, '25
NYM 12 - WAS 6
|
L +202 | o8.5 | 3.1 | 7 | 6 | 4 | 4 | 1 | 0 | 81 | 24.3 | 4.0 |
|
Sep 30, '17
PHI 4 - NYM 7
|
L -122 | o8.5 | 4.2 | 5 | 3 | 3 | 0 | 6 | 0 | 0 | 0.0 | 3.5 |
| Last 3 Avg. | 4.1 | 4.7 | 3.7 | 3.0 | 2.7 | 2.7 | 0.3 | 51.3 | 12.4 | 2.8 |
| Team | ERA | AVG. | OBP | WHIP | IP | HR | BB | K |
|---|---|---|---|---|---|---|---|---|
|
New York
|
4.14 | .239 | .316 | 1.28 | 8.2 | 1.1 | 3.4 | 9.0 |
|
Washington
|
4.67 | .254 | .332 | 1.38 | 8.2 | 1.3 | 3.6 | 7.9 |
| Team | Runs/9 | ERA | AVG. | OBP | WHIP | IP | HR | BB | K |
|---|---|---|---|---|---|---|---|---|---|
|
New York
|
4.84 | 4.45 | .246 | .326 | 1.33 | 4.2 | 0.6 | 1.9 | 4.9 |
|
Washington
|
4.71 | 4.32 | .247 | .322 | 1.31 | 4.1 | 0.6 | 1.6 | 4.1 |
| Team | Runs/9 | ERA | AVG. | OBP | WHIP | IP | HR | BB | K |
|---|---|---|---|---|---|---|---|---|---|
|
New York
|
4.20 | 3.75 | .231 | .302 | 1.23 | 4.0 | 0.5 | 1.4 | 4.0 |
|
Washington
|
5.47 | 5.01 | .260 | .342 | 1.45 | 4.1 | 0.7 | 2.0 | 3.8 |