
Women’s sports are experiencing a historic surge, driven by record-breaking attendance, media visibility, and grassroots participation. But the strength of that momentum still depends heavily on where you live.
Some cities are embracing the moment with packed arenas, championship infrastructure, and thriving youth pipelines. Others are falling behind, held back by limited representation, minimal demand, or a lack of cultural traction.
To better understand where that support is strongest, we built a multi-pillar index measuring everything from pro venue quality and attendance demand to collegiate output, participation rates, media visibility, and recent growth trends. The result: a first-of-its-kind snapshot of America’s most complete women’s sports ecosystems.
This year’s rankings reveal clear trends: powerhouse markets leveraging visibility and infrastructure to stay on top, rising mid-market cities riding energized fanbases, and pockets where participation hasn’t yet translated to cultural footprint. Whether you’re a fan looking for the best environments or a league searching for growth opportunities, these cities show where the movement is thriving most.
🔑 Key Takeaways
-
Los Angeles claims the No. 1 spot, powered by elite visibility, strong collegiate output, and consistently high demand across premier venues
-
New York lands at No. 2 thanks to dominant search interest, a deep athlete pipeline, and cultural footprint – even with modest recent growth
-
Indianapolis is the biggest riser in the Top 10, driven by best-in-class attendance momentum and capacity demand
-
Portland, Ore., boasts the nation’s strongest pro attendance profile, reinforcing its reputation as one of the most fiercely supportive women’s sports markets
- California is the place to be for prospective women's star athletes, placing four cities inside the top 20
- Arlington, Texas has the dubious distinction of being the worst major city in the U.S. for women's athletics
🔢 Methodology
We evaluated the 50 most populous U.S. cities on women’s sports across five areas: professional presence, college output, participation/pipeline, fan demand, and media/buzz. Every metric was min–max normalized and then combined using the weights below to create a single city score.
1. Professional presence
- Pro teams count – WNBA, PWHL, NWSL, USL Super League, PVF
- Pro average attendance – average per game across all women’s pro teams in the city
- Pro championships (last 10 years) – total titles from women’s pro teams
- Average venue rating – Google review average for women’s pro venues
2. Collegiate strength
- NCAA championship appearances (10 years) – D1 women’s basketball, soccer, volleyball
- NCAA championship wins (10 years) – same sports as above
- College women’s basketball average attendance – D1 home attendance averaged at the city level
3. Participation & grassroots
- High school girls’ sports per 1,000 population – state data scaled to city population
- Youth registrations (girls 6–17) – 2024 rate matched to each city’s state
- Girls’ share of total participation – girls’ participation ÷ all participation
4. Fan interest & demand
- Attendance growth (2 years) – 2024 avg. attendance ÷ 2022 avg. attendance
- Ticket demand index – attendance ÷ capacity for women’s pro venues
- Women’s sports search volume – 12-month Google Keyword Planner average by city
5. Media & social buzz
- News coverage count – “women’s sports” + city name hits via GDELT (last 2 years)
- Social mentions (3 years) – Reddit/r-Sports posts and comments mentioning women’s leagues/teams by location
All metrics were min–max normalized before weighting. Cities with missing data in a submetric were scored on the remaining available metrics within that pillar.
Scoring & weights
| Pillar | Submetric | Weight (%) |
|---|---|---|
| Professional presence | Pro teams count | 15 |
| Professional presence | Pro average attendance | 10 |
| Professional presence | Pro championships (10 yr) | 7 |
| Professional presence | Average venue rating | 5 |
| Collegiate strength | NCAA championship appearances (10 yr) | 10 |
| Collegiate strength | NCAA championship wins (10 yr) | 5 |
| Collegiate strength | College women’s basketball avg. attendance | 5 |
| Participation & pipeline | HS girls per 1,000 (city-scaled) | 7 |
| Participation & pipeline | Youth registrations (girls 6–17) | 5 |
| Participation & pipeline | Girls’ participation share | 3 |
| Fan interest & demand | Attendance growth (2 yr) | 7 |
| Fan interest & demand | Ticket demand index | 7 |
| Fan interest & demand | Women’s sports search volume | 6 |
| Media & social buzz | News coverage count | 4 |
| Media & social buzz | Social mentions (3 yr) | 4 |
Final city scores were calculated by summing the weighted, normalized values across all submetrics.
The 10 Best Cities for Women's Sports
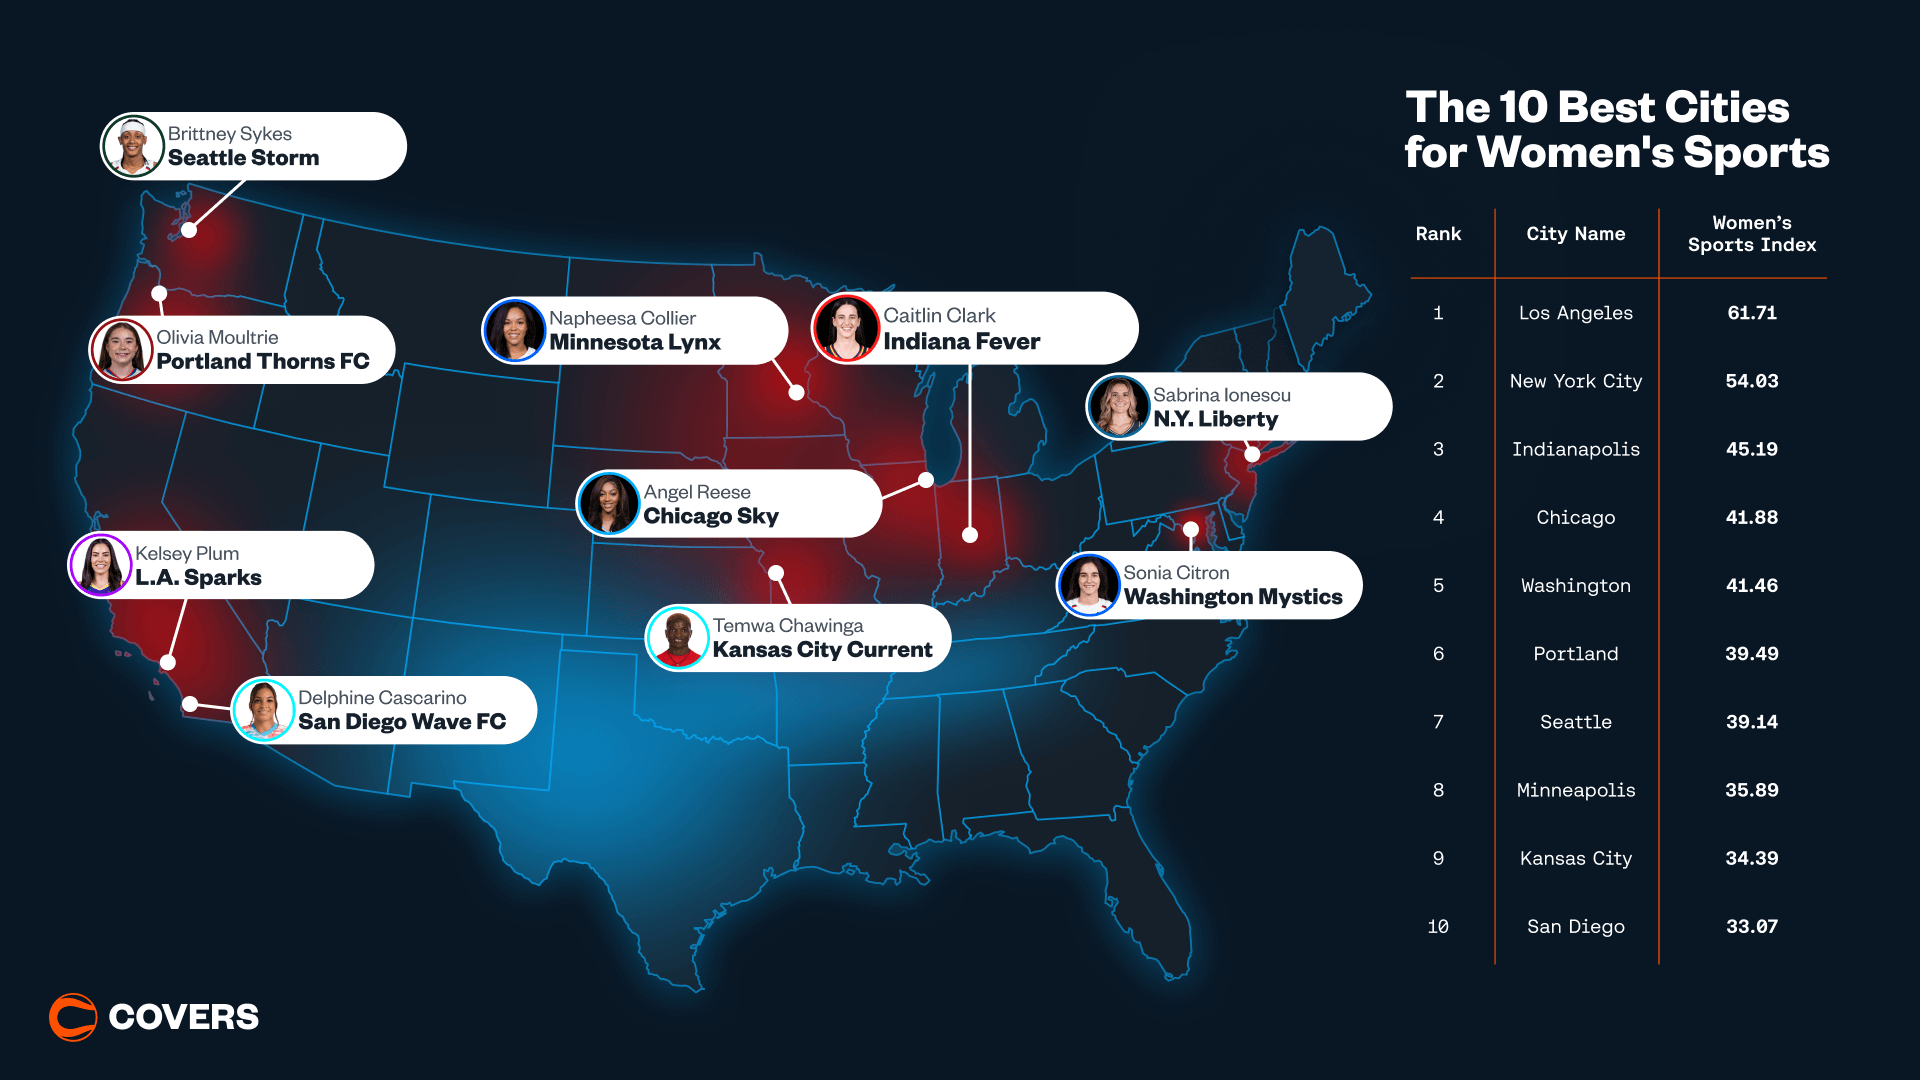
1. Los Angeles (61.71)
Notable teams: ![]() Los Angeles Sparks (WNBA), Angel City FC (NWSL),
Los Angeles Sparks (WNBA), Angel City FC (NWSL), ![]() UCLA Bruins (NCAAWBB),
UCLA Bruins (NCAAWBB), ![]() USC Trojans (NCAAWBB)
USC Trojans (NCAAWBB)
Notable athletes: Kelsey Plum, Dearica Hamby, Cameron Brink, Riley Tiernan, Alyssa Thompson, Gianna Kneepkens, Lauren Betts
Pro footprint: Solid team presence with elite venue ratings
Attendance & demand: Strong attendance and high capacity demand
Recent momentum: Modest growth over the past two seasons
Collegiate output: Elite appearances and titles; average college WBB draw
Participation pipeline: Above-average HS engagement and youth activity
Visibility: Market-leading media and search volume
🏆 Why it lands here
Los Angeles claims the No. 1 spot thanks to a rare combination of collegiate dominance, consistent in-venue support, and sustained media oxygen. The city’s powerhouse programs continue to feed national-caliber athletes into the pro ecosystem, helping to stabilize attendance and community interest. Where LA really separates itself is visibility: the city generates outsized media mentions and search behavior around women’s sports, signaling a broader cultural footprint. Growth has flattened recently, but the size, infrastructure, and attention behind this market continue to make it the most complete ecosystem in the country.
2. New York (54.03)
Notable teams: ![]() New York Liberty (WNBA), Gotham FC (NWSL)
New York Liberty (WNBA), Gotham FC (NWSL)
Notable athletes: Breanna Stewart, Sabrina Ionescu, Esther Gonzalez
Pro footprint: Elite team profile with strong venue ratings and recent title signal
Attendance & demand: Mid-tier attendance with modest capacity demand
Recent momentum: Flat growth over the last two seasons
Collegiate output: Solid championship appearances; limited title conversion
Participation pipeline: Top-tier high school engagement; strong youth registration rates
Visibility: No. 1 search interest; high media presence; mid social activity
🏆 Why it lands here
New York’s sheer scale drives results across multiple pillars. The city’s elite high school participation rate suggests a deep athlete pipeline, and the pro landscape continues to benefit from strong venues and competitive consistency. While recent attendance growth hasn’t accelerated, baseline demand remains healthy. What ultimately elevates NYC into the No. 2 spot is visibility. Search behavior, coverage volume, and cultural traction around women’s sports consistently outpace other markets. Even with limited collegiate title conversion and modest building-fill rates, New York’s media influence keeps it firmly in the national top tier.
3. Indianapolis (45.19)
Notable teams: ![]() Indiana Fever (WNBA), IU Indy Jaguars (NCAAWBB), Indy Ignite (MLV)
Indiana Fever (WNBA), IU Indy Jaguars (NCAAWBB), Indy Ignite (MLV)
Notable athletes: Caitlin Clark, Aliyah Boston, Kelsey Mitchell, Sophie Cunningham
Pro footprint: Solid team presence with strong venue quality and recent titles
Attendance & demand: Strong attendance with elite capacity demand
Recent momentum: Best-in-class growth over the past two seasons
Collegiate output: Limited NCAA appearances and titles; mid college WBB draw
Participation pipeline: Mid high school and youth engagement rates
Visibility: Mid-tier search and media presence; strong Reddit activity
🏆 Why it lands here
Indianapolis stands out for how quickly its fanbase has accelerated. No market in the Top 10 has seen such a sharp uptick in attendance growth, and demand versus capacity has become a defining strength. With buildings consistently energized, pro teams have begun to attract national attention. Despite modest collegiate title output and middling participation rates, Indy’s surge reflects cultural momentum. The combination of packed venues, rising conversation, and recent championship relevance pushes the city ahead of several larger markets.
4. Chicago (41.88)
Notable teams: ![]() Chicago Sky (WNBA), Chicago Stars FC (NWSL)
Chicago Sky (WNBA), Chicago Stars FC (NWSL)
Notable athletes: Angel Reese, Kamilla Cardoso, Courtney Vandersloot, Ludmila
Pro footprint: Solid professional presence with strong venue quality and decade-long competitive relevance
Attendance & demand: Mid attendance with strong capacity demand
Recent momentum: Low growth over the past two seasons
Collegiate output: Solid appearances; limited recent titles; low-to-mid college WBB attendance
Participation pipeline: Strong high school engagement and youth registration
Visibility: Strong media presence and elite Reddit conversation
🏆 Why it lands here
Chicago benefits from depth. Its pro teams deliver reliable competitive standing, venues score well with fans, and capacity demand remains among the strongest in the country. High school participation rates point to a healthy long-term pipeline, even if collegiate titles have been elusive. Where Chicago shines most is discussion energy. National coverage and social conversation consistently feature the city, indicating an engaged audience that extends beyond the arena. Growth rates are flat, but the foundation is unquestionably strong.
5. Washington, D.C. (41.46)
Notable teams: ![]() Washington Mystics (WNBA), Washington Spirit (NWSL)
Washington Mystics (WNBA), Washington Spirit (NWSL)
Notable athletes: Sonia Citron, Kiki Iriafen, Shakira Austin, Gift Monday, Trinity Rodman
Pro footprint: Strong pro presence with strong venue quality and recent title success
Attendance & demand: Mid attendance with strong demand relative to capacity
Recent momentum: Flat growth over the past two seasons
Collegiate output: Strong appearances; limited titles; solid college WBB draw
Participation pipeline: Exceptional girls’ participation share and elite youth registration
Visibility: Mid search interest; lower media frequency; modest social conversation
🏆 Why it lands here
Washington’s combination of recent championship pedigree and robust grassroots participation forms a sturdy platform. The city’s youth registration rates and high proportion of girls participating in sports signal long-term growth potential, and demand versus capacity reflects reliable support inside venues. Media and social buzz are quieter than other markets in the Top 10, holding D.C. back from rising higher. Still, the intersection of competitive relevance and strong participation metrics keeps it well inside the upper tier.
6. Portland (39.49)
Notable teams: Portland Thorns FC (NWSL), Portland Fire (WNBA, coming in 2026), Portland Pilots (NCAAWBB)
Notable athletes: Olivia Moultrie, Sophia Wilson
Pro footprint: Smaller team count but elite venue ratings and championship signal
Attendance & demand: National-best attendance with strong demand metrics
Recent momentum: Low growth over the past two seasons
Collegiate output: Limited NCAA appearances and titles; low college WBB attendance
Participation pipeline: Solid high school and youth activity levels
Visibility: Solid media presence; low social conversation; mid search interest
🏆 Why it lands here
Portland stands alone in one category: sheer turnout. No other market matches its average pro attendance profile, and the strength of demand relative to capacity reinforces that this support is real, not a novelty. Venue quality further boosts the in-game experience. What tempers Portland’s ranking is collegiate performance and lower conversation volume. Despite these gaps, the Thorns-led attendance powerhouse effect is strong enough to cement it comfortably at No. 6.
7. Seattle (39.14)
Notable teams: ![]() Seattle Storm (WNBA), Seattle Reign FC (NWSL)
Seattle Storm (WNBA), Seattle Reign FC (NWSL)
Notable athletes: Brittney Sykes, Nneka Ogwumike, Skylar Diggins, Gabby Williams, Claudia Dickey
Pro footprint: Solid team presence with strong venues and championship pedigree
Attendance & demand: Solid attendance and strong capacity demand
Recent momentum: Low growth over the past two seasons
Collegiate output: Strong NCAA appearance volume; limited titles; solid college WBB draw
Participation pipeline: Solid high school and youth activity
Visibility: Mid media presence, mid social conversation, mid search interest
🏆 Why it lands here
Seattle’s reliability is its defining advantage. The Storm’s winning legacy, strong arena ratings, and consistent fan turnout keep the market nationally relevant. Moreover, NCAA appearance volume helps sustain year-round interest. While nothing spikes into elite territory outside titles and attendance demand, very few metrics fall flat. That balance is enough for a steady, well-earned No. 7 placement.
8. Minneapolis (35.89)
Notable teams: ![]() Minnesota Lynx (WNBA), Minnesota Aurora FC (USL W League)
Minnesota Lynx (WNBA), Minnesota Aurora FC (USL W League)
Notable athletes: Napheesa Collier, Kayla McBride, Courtney Williams
Pro footprint: Smaller team footprint with strong venues and championship relevance
Attendance & demand: Solid attendance with mid-ticket demand
Recent momentum: Low growth over the past two seasons
Collegiate output: Solid appearances; limited titles; elite college WBB attendance
Participation pipeline: Strong high school and youth registration rates
Visibility: Mid search interest; lower media presence; low social conversation
🏆 Why it lands here
Minneapolis lands in the Top 10 by virtue of a powerful collegiate culture and consistently supportive local infrastructure. Elite college basketball attendance distinguishes the market, and high school participation continues to feed a stable athlete pipeline. Where the city lags is visibility. Media coverage and social conversation don’t match on-court engagement, and demand relative to capacity sits slightly below its peers. Still, the foundational pieces are rock-solid.
9. Kansas City (34.39)
Notable teams: Kansas City Current (NWSL), UMKC Roos (NCAAWBB)
Notable athletes: Temwa Chawinga, Debinha, Izzy Rodriguez, Hailie Mace, Lorena da Silva Leite
Pro footprint: Smaller pro slate with elite venue ratings and championship relevance
Attendance & demand: Strong attendance; No. 1-ticket-demand tier
Recent momentum: Low-to-mid growth over the past two seasons
Collegiate output: Limited NCAA appearances and titles; low college WBB attendance
Participation pipeline: Solid youth participation; modest high school activity
Visibility: Solid media presence; elite Reddit conversation; low search interest
🏆 Why it lands here
Kansas City is a breakout narrative. Capacity demand is the strongest of any Top 10 city, reflecting packed buildings and energized fan culture. Low-to-mid recent growth suggests the rise isn’t cooling anytime soon. Despite limited collegiate firepower, the pro environment and conversation volume help elevate KC above several larger markets. This is a market on the move.
10. San Diego (33.07)
Notable teams: San Diego Wave FC (NWSL), San Diego State Aztecs (NCAAWBB)
Notable athletes: Delphine Cascarino, Kenza Dali, Kennedy Wesley
Pro footprint: Solid team presence with strong venues and recent title signal
Attendance & demand: Strong attendance with mid capacity demand
Recent momentum: Flat growth over the past two seasons
Collegiate output: Solid NCAA appearances; limited titles; low-to-mid college WBB attendance
Participation pipeline: Solid high school activity and strong youth registrations
Visibility: Solid media presence; mid social conversation; mid search interest
🏆 Why it lands here
San Diego benefits from steady pro support and a healthy participation pipeline. Strong youth registrations in particular drive long-term optimism and help balance limited collegiate hardware. What holds the ranking back is momentum: attendance growth has stagnated, and demand doesn’t spike the way it does in other rising markets. Even so, consistency across key pillars keeps San Diego inside the Top 10.
The 5 Worst Cities for Women's Sports
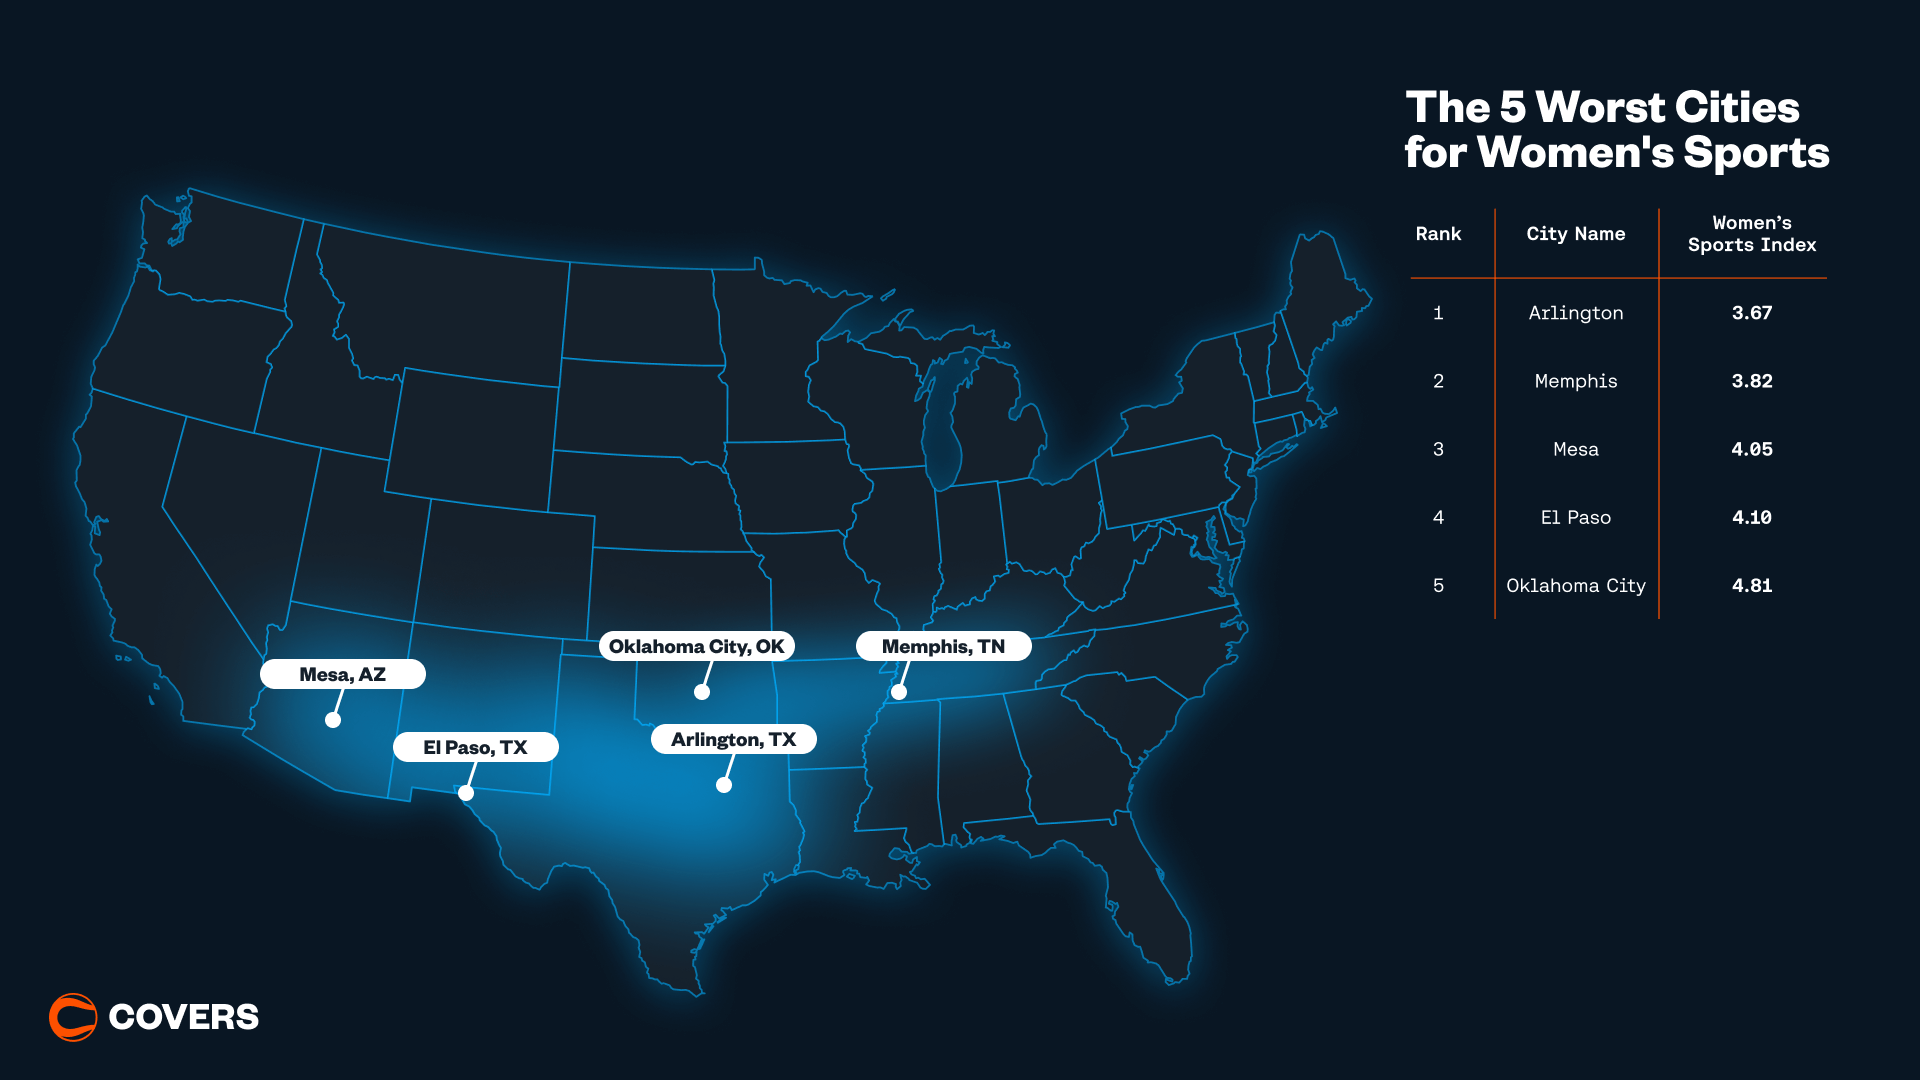
1. Arlington (3.67)
Pro footprint: No women’s pro teams included in the index
Attendance & demand: No qualifying attendance data; no capacity demand
Recent momentum: No attendance growth signal
Collegiate output: Limited NCAA appearances; no recent titles; low college WBB draw
Participation pipeline: Low high school engagement and modest youth registration
Visibility: Very low media presence, search interest, and social conversation
📉 Why it lands here
Arlington scores near the bottom due to a complete absence of women’s pro representation within the indexed leagues and a minimal collegiate postseason footprint. Without either pillar driving interest or infrastructure, visibility suffers, and participation struggles to gain traction. The lack of sustained conversation around women’s sports — across media, search behavior, and social discussion — compounds the issue. Arlington’s score reflects a market where women’s sports activity remains sparse across almost every measurable layer.
2. Memphis (3.82)
Pro footprint: No women’s pro teams included in the index
Attendance & demand: No qualifying attendance data; no capacity demand
Recent momentum: No attendance growth signal
Collegiate output: Limited NCAA postseason relevance; low college WBB attendance
Participation pipeline: Minimal high school engagement and moderate youth registration
Visibility: Very low media presence and social conversation; low search interest
📉 Why it lands here
Memphis is hindered by an absence of top-level women’s pro representation and an underdeveloped collegiate postseason track record. Even with moderate youth activity, the broader infrastructure needed to elevate women’s sports simply isn’t in place. Media presence and conversation volume are also low, offering little cultural lift. With limited pressure from demand or visibility, Memphis settles into the bottom tier of the index.
3. Mesa (4.05)
Pro footprint: No women’s pro teams included in the index
Attendance & demand: No qualifying attendance or ticket demand signal
Recent momentum: No attendance growth available
Collegiate output: Minimal NCAA postseason appearances; no recent titles; low college WBB draw
Participation pipeline: Solid high school engagement and moderate youth registration
Visibility: Very low media mentions and social conversation; low search intensity
📉 Why it lands here
Mesa’s score reflects a structural absence of pro representation and a limited collegiate postseason profile. While high school engagement is higher than several peers in the bottom tier, the lack of college attendance and championship activity blunts any momentum. Media and social visibility remain minimal, and without any demand-driven pressure from pro events, Mesa lacks a platform for cultural traction around women’s sports.
4. El Paso (4.10)
Pro footprint: No women’s pro teams included in the index
Attendance & demand: No qualifying attendance data; no capacity demand
Recent momentum: No attendance growth signal
Collegiate output: Minimal NCAA postseason relevance; low college WBB attendance
Participation pipeline: Modest high school engagement and youth registration
Visibility: Very low media presence; minimal social and search footprint
📉 Why it lands here
El Paso’s position near the bottom stems from a limited college profile and no pro representation within the indexed leagues. Without postseason appearances or title activity, collegiate output offers little support. The city’s participation pipeline is modest, not compensating for sparse visibility. With minimal conversation volume and demand signals, El Paso struggles to surface in the national women’s sports landscape.
5. Oklahoma City (4.81)
Pro footprint: No women’s pro teams included in the index
Attendance & demand: No qualifying pro attendance; no capacity demand
Recent momentum: No attendance growth available
Collegiate output: Limited NCAA postseason volume; no recent titles; no college WBB attendance signal
Participation pipeline: Moderate high school participation and youth engagement
Visibility: Very low media presence; minimal search intensity; low social conversation
📉 Why it lands here
Oklahoma City sits in the bottom five primarily because it lacks a visible professional foundation for women’s sports within the indexed leagues. Collegiate postseason activity and titles are scarce, and college women’s basketball attendance offers no lift. While participation isn’t the lowest, the absence of demand, momentum, and visibility leaves the market without mechanisms to elevate interest. All together, these structural gaps anchor Oklahoma City firmly near the bottom.


