
“A 31-28 split is exactly what randomness predicts.”
That’s how Tim Chartier, an applied mathematician specializing in sports analytics, explains the trend behind one of the NFL’s most debated rituals: the Super Bowl coin toss.
On paper, the toss is a simple binary event – heads or tails, win or lose. In practice, it has produced nearly six decades of perceived patterns, infamous streaks, team-specific lore and betting superstitions that resurface every February.
To understand why, we analyzed all 59 Super Bowl coin tosses, examined how results cluster by era, looked at which teams have actually benefited from winning the flip, and tested whether the so-called “coin toss curse” holds up under statistical scrutiny – all with the Super Bowl 60 landscape firmly in view.
What emerges is a familiar sports paradox: the data insists the coin is fair, while fans remain convinced it isn’t.
📌 Key takeaways
🪙 Coin-toss winners lose more Super Bowls than they win: just 25 wins in 59 games (42.4%).
🪙 The “coin toss curse” wasn’t freakish: the eight-game losing streak had about a 10% chance of happening naturally.
🪙 Heads vs Tails is effectively even: “a 31-28 split is exactly what randomness predicts,” says Chartier.
🪙 Streaks feel shocking because humans misread randomness, not because the coin is biased.
🪙 Some teams convert toss wins far better than others: the 49ers (4-of-5) and Dolphins (3-of-4) lead.
🪙 Others consistently fail to capitalize: the Patriots (0-of-3) and Seahawks (1-of-3) trail.
Enjoying Covers content? Add us as a preferred source on your Google account
Super Bowl historical coin toss results
Here's a look at the coin toss results across every Super Bowl, along with whether the team that won the toss also prevailed in the game:
| Super Bowl | Result | Winner | Super Bowl Win? |
|---|---|---|---|
| 1 | Heads | Packers | Yes |
| 2 | Tails | Raiders | No |
| 3 | Heads | Jets | Yes |
| 4 | Tails | Vikings | No |
| 5 | Tails | Cowboys | No |
| 6 | Heads | Dolphins | No |
| 7 | Heads | Dolphins | Yes |
| 8 | Heads | Dolphins | Yes |
| 9 | Tails | Steelers | Yes |
| 10 | Heads | Cowboys | No |
| 11 | Tails | Raiders | Yes |
| 12 | Heads | Cowboys | Yes |
| 13 | Heads | Cowboys | No |
| 14 | Heads | Rams | No |
| 15 | Tails | Eagles | No |
| 16 | Tails | 49ers | Yes |
| 17 | Tails | Dolphins | No |
| 18 | Heads | Raiders | Yes |
| 19 | Tails | 49ers | Yes |
| 20 | Tails | Bears | Yes |
| 21 | Tails | Broncos | No |
| 22 | Heads | Redskins | Yes |
| 23 | Tails | 49ers | Yes |
| 24 | Heads | Broncos | No |
| 25 | Heads | Bills | No |
| 26 | Heads | Redskins | Yes |
| 27 | Heads | Bills | No |
| 28 | Tails | Cowboys | Yes |
| 29 | Heads | 49ers | Yes |
| 30 | Tails | Cowboys | Yes |
| 31 | Heads | Patriots | No |
| 32 | Tails | Packers | No |
| 33 | Tails | Falcons | No |
| 34 | Tails | Rams | Yes |
| 35 | Tails | Giants | No |
| 36 | Heads | Rams | No |
| 37 | Tails | Buccaneers | Yes |
| 38 | Tails | Panthers | No |
| 39 | Tails | Eagles | No |
| 40 | Tails | Seahawks | No |
| 41 | Heads | Bears | No |
| 42 | Tails | Giants | Yes |
| 43 | Heads | Cardinals | No |
| 44 | Heads | Saints | Yes |
| 45 | Heads | Packers | Yes |
| 46 | Heads | Patriots | No |
| 47 | Heads | Ravens | Yes |
| 48 | Tails | Seahawks | Yes |
| 49 | Tails | Seahawks | No |
| 50 | Tails | Panthers | No |
| 51 | Tails | Falcons | No |
| 52 | Heads | Patriots | No |
| 53 | Tails | Rams | No |
| 54 | Tails | 49ers | No |
| 55 | Heads | Chiefs | No |
| 56 | Heads | Bengals | No |
| 57 | Tails | Chiefs | Yes |
| 58 | Heads | Chiefs | Yes |
| 59 | Tails | Chiefs | No |
🪙 A perfectly crafted coin: Built for fairness, blamed for chaos
Every Super Bowl coin is produced by the Highland Mint in Melbourne, Fla., under strict manufacturing standards.
“Even when helmet designs change or logos shift, the weight difference is imperceptible – no more than a milligram,” Vince Bohbot, executive vice president of the Highland Mint, told Covers prior to Super Bowl 59.
The coin itself is engineered to eliminate bias. If it isn’t introducing an edge, then whatever fans believe they’re seeing has to live somewhere else. And this is where the numbers come in.
🔄 Heads vs tails: six decades of pure chance (or is it?)
Across 59 Super Bowls:
- Heads: 28
- Tails: 31
A narrow edge for tails – and a modest victory for the “Tails Never Fails” crowd (which is larger than you might think).
But at this scale, Chartier says the result is exactly what probability predicts.
“In mathematical terms, it isn’t. In the vast scale where probability theory becomes decisive, 58 is tiny – barely enough to see the natural noise settle down.”
In fact:
“Outcomes of 31-28 (in either direction) are among the most common results for 59 fair flips."
According to Chartier, the real trap isn’t the total count: it’s how those results cluster over time.
When the coin toss is broken down by era rather than totals, it becomes clear why certain decades feel lopsided, even though the overall result remains balanced.
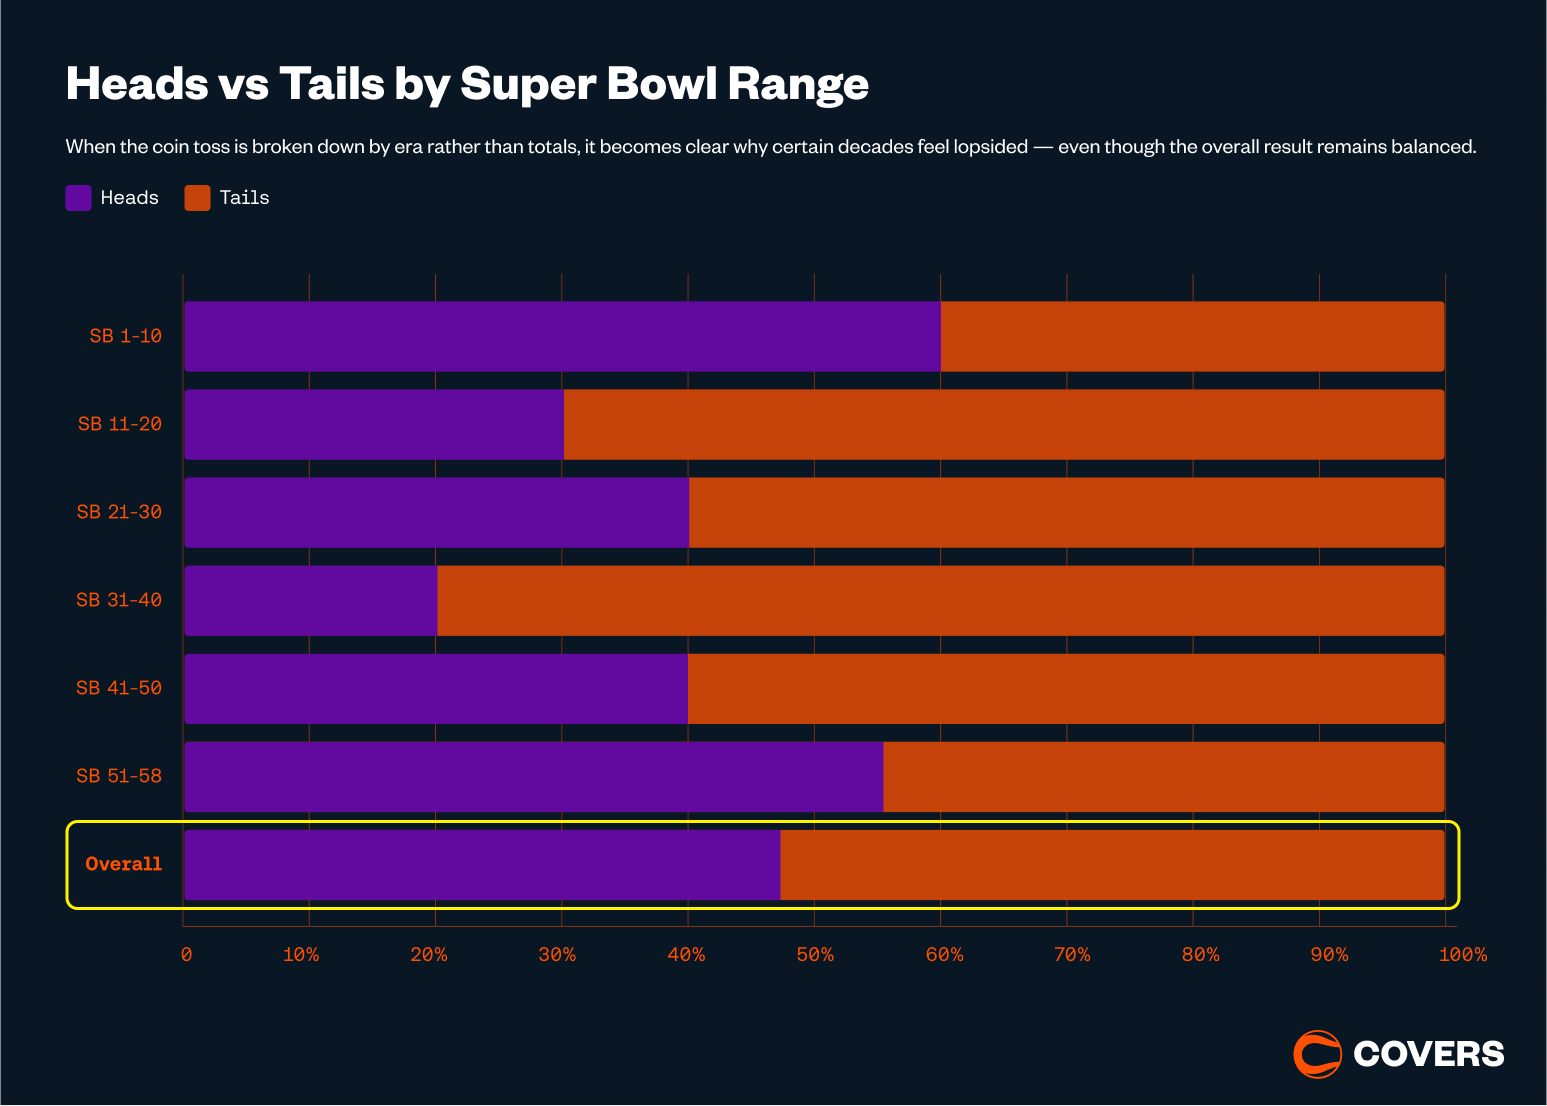
Short-term imbalances are a normal feature of random systems. Fans remember the “Tails eras” because streaks are memorable — not because the coin changed.
“Eras of imbalance are completely normal in random processes,” Chartier explains.
😱 The Coin Toss Curse: Winning the flip means losing the Super Bowl
Heads versus tails isn’t the pattern fans obsess over most.
The belief really hardens when the flip appears to affect the game itself. And that’s where the idea of a “coin toss curse” takes hold.
Only 25 of 59 coin-toss winners went on to win the Super Bowl. That’s a 42.4% win rate. Much worse than an even split.
The narrative peaked between Super Bowl XLIX and LVI, when coin-toss winners lost eight straight Super Bowls.
At first glance, that streak feels impossible.
“If you focus on a specific starting point, the probability of losing eight in a row is 1 in 256,” Chartier says.
But that’s the wrong question.
“A better question is broader: what is the probability that somewhere within the 59 Super Bowls played so far, an eight-game losing streak occurs?”
The answer reframes everything:
“About 10%. That’s not common, but it’s also not wildly improbable.”
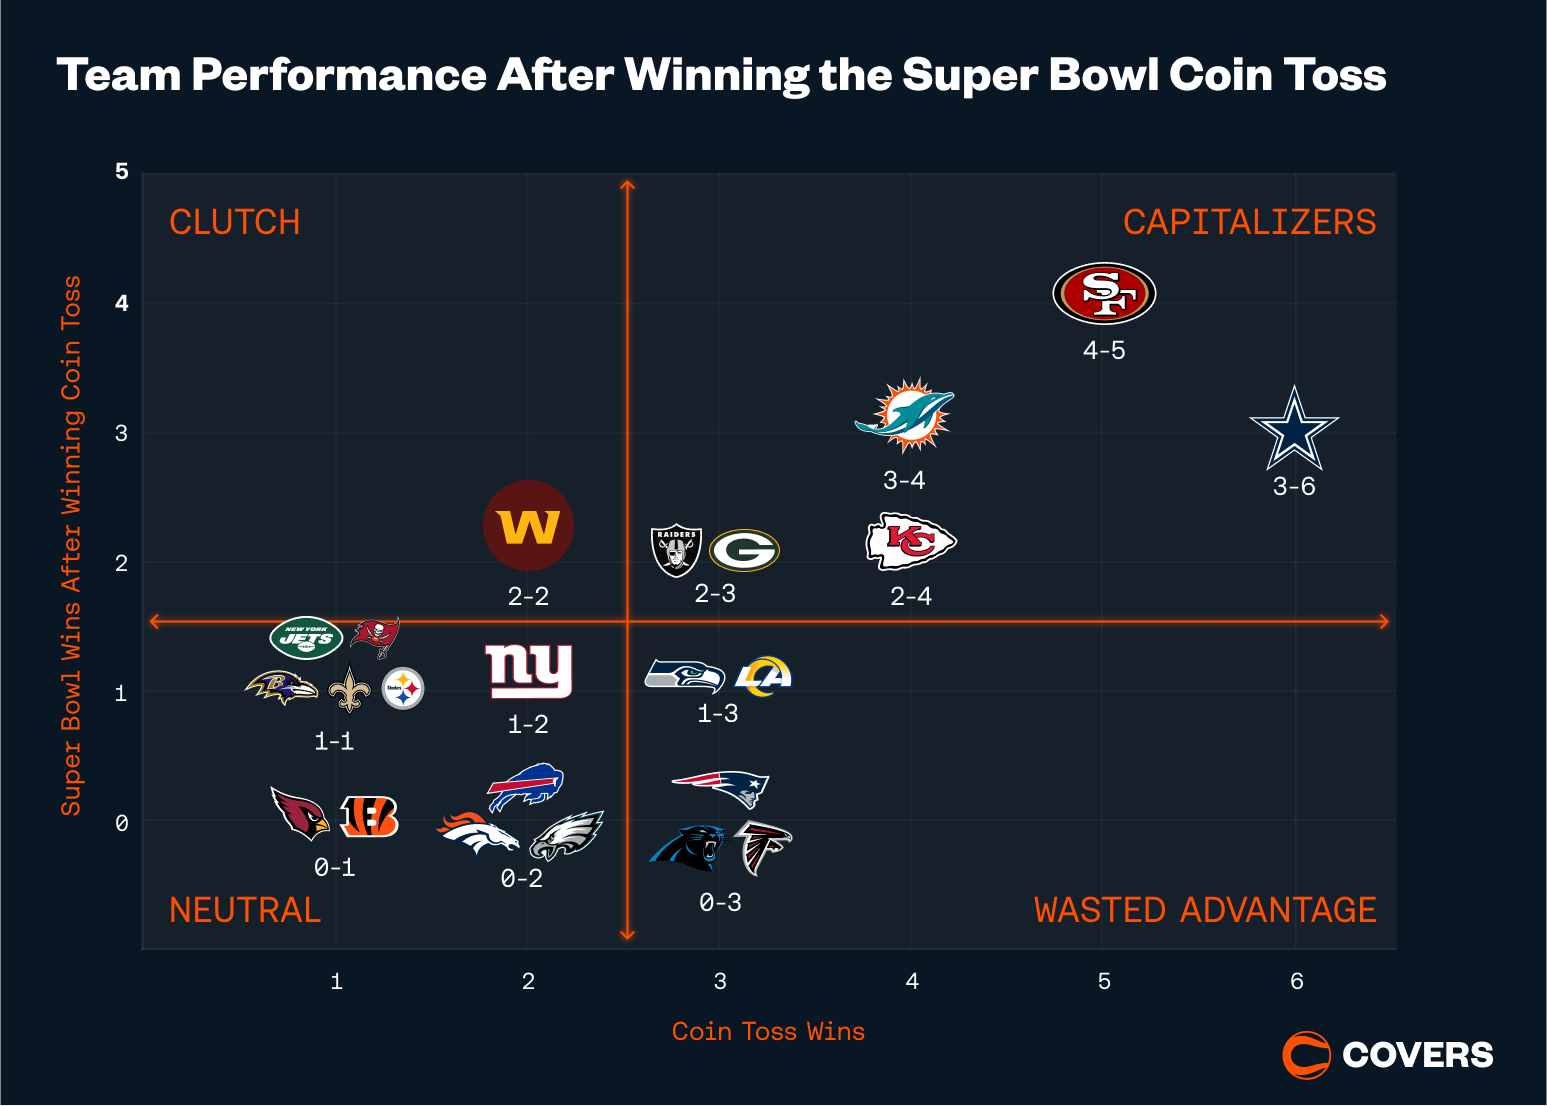
Some teams have historically converted a toss win into a championship far more often than others, despite small sample sizes.
Standouts:
- 49ers: 5 toss wins → 4 Super Bowl wins
- Dolphins: 4 → 3
- Chiefs: 4 → 2
- Packers: 3 → 2
Strugglers:
- Patriots: 3 → 0
- Falcons: 3 → 0
- Panthers: 3 → 0
- Seahawks: 3 → 1
- Rams: 3 → 1
🏈 What coin toss history means for 2026 contenders
With Super Bowl odds locked in (for the most part), those long-standing coin-toss narratives are now front and center – and neither team has fared well at turning a coin-flip win into a Super Bowl parade.
The Patriots, for example, have lost all three Super Bowls in which they won the opening coin toss, giving them the worst conversion record among current NFL franchises. The Seahawks have also won the toss three times, converting it into a championship just once – a history that superstition-minded fans won’t ignore if the opening flip breaks their way in Super Bowl 2026.
It’s exactly the kind of coincidence that fuels February, and yet, Chartier remains unmoved.
“Randomness has no memory, and it doesn’t rush to fix the past.”


