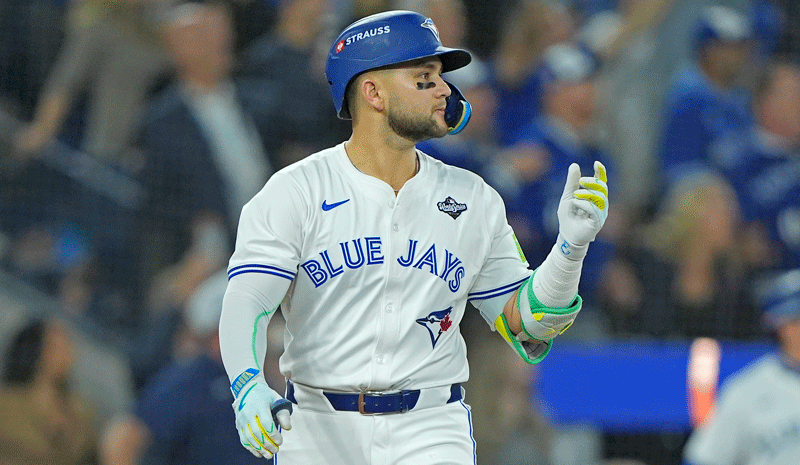
Toronto @ Miami Picks & Props
TOR vs MIA Picks
MLB PicksCheck out all baseball picks and predictions
Latest headlines Checkout latest headlinesRead more
TOR vs MIA Consensus Picks
 63% picking Toronto
Total PicksTOR 229, MIA 132
 64% picking Toronto
Total PicksTOR 239, MIA 137
TOR vs MIA Props
Bryan De La Cruz Total Hits Props • Miami
LoanDepot Park's elevation is near sea-level, one of the lowest in MLB, which generally leads to worse offense. The LoanDepot Park roof figures to be closed today, making conditions in this contest -5° colder than the average outdoor game on the slate today — favorable for pitching. Jose Berrios will hold the platoon advantage against Bryan De La Cruz in today's game. The Toronto Blue Jays outfield defense profiles as the best on the slate. Bryan De La Cruz's exit velocity on flyballs has decreased this year; his 95.8-mph mark last season has decreased to 93.1-mph.
Whit Merrifield Total Hits Props • Toronto
THE BAT X projects Whit Merrifield in the 93rd percentile when it comes to his batting average ability. Whit Merrifield has primarily hit in the back-half of the batting order this year (76% of the time), but he is projected to hit 2nd in the lineup today. Whit Merrifield's ability to hit the ball at a base hit-maximizing launch angle (between -4° and 26°) has increased from last season to this one, rising from 42.5% to 49.5%. Whit Merrifield has put up a .295 Expected Batting Average this year, ranking in the 94th percentile (according to THE BAT X's interpretation of Statcast data). Whit Merrifield has posted a .310 batting average this year, grading out in the 97th percentile.
Spencer Horwitz Total Hits Props • Toronto
Spencer Horwitz will hold the platoon advantage over Bryan Hoeing in today's game.
Cavan Biggio Total Hits Props • Toronto
Cavan Biggio will have the benefit of the platoon advantage against Bryan Hoeing today. Cavan Biggio has made big improvements with his Barrel%, upping his 7% rate last year to 15.4% this year. Cavan Biggio has seen a big gain in his exit velocity on flyballs this year; just compare his 93.5-mph average to last year's 89.3-mph figure. Cavan Biggio's ability to hit the ball at a HR-maximizing launch angle (between 23° and 34°) has increased from last year to this one, going from 20.3% to 30.8%.
George Springer Total Hits Props • Toronto
THE BAT X projects George Springer in the 93rd percentile as it relates to his overall offensive ability. George Springer is penciled in 1st in the lineup in this matchup. LoanDepot Park has the shallowest centerfield dimensions among all parks. George Springer has suffered from bad luck when it comes to his wOBA this year; his .318 rate is a good deal lower than his .354 Expected wOBA (based on THE BAT X's interpretation of Statcast data). George Springer's maximum exit velocity (an advanced standard to measure power) has been 115.9 mph this year, grading out in the 97th percentile.
Daulton Varsho Total Hits Props • Toronto
Daulton Varsho is projected to hit 5th on the lineup card in this matchup. Daulton Varsho will receive the benefit of the platoon advantage against Bryan Hoeing in today's game. Daulton Varsho's launch angle this year (17.9°) is significantly better than his 14.5° figure last season. Daulton Varsho has had some very poor luck with his batting average this year; his .231 BA is deflated compared to his .260 Expected Batting Average (based on THE BAT X's interpretation of Statcast data).
Kevin Kiermaier Total Hits Props • Toronto
THE BAT X projects Kevin Kiermaier in the 81st percentile when it comes to his BABIP talent. Kevin Kiermaier will hold the platoon advantage over Bryan Hoeing in today's game. Kevin Kiermaier hits a high percentage of his flyballs to center field (39.2% — 89th percentile) and will have a big advantage facing the game's 6th-shallowest CF fences in today's matchup. Kevin Kiermaier has posted a .280 batting average this year, ranking in the 83rd percentile.
Danny Jansen Total Hits Props • Toronto
Extreme flyball hitters like Danny Jansen tend to perform better against extreme groundball pitchers like Bryan Hoeing. Danny Jansen's average launch angle on his hardest-contacted balls this season (20.9°) is a significant increase over his 15° figure last year. Danny Jansen has been unlucky in regards to his batting average this year; his .210 rate is quite a bit lower than his .253 Expected Batting Average (based on THE BAT X's interpretation of Statcast data). Danny Jansen's 11.9% Barrel% (an advanced standard to evaluate power) ranks in the 81st percentile this year. Danny Jansen has compiled a .337 wOBA (the best measure of overall offense) since the start of last season, checking in at the 78th percentile.
Matt Chapman Total Hits Props • Toronto
THE BAT X projects Matt Chapman in the 95th percentile as it relates to his overall offensive ability. Matt Chapman hits a lot of his flyballs to center field (39.2% — 89th percentile) and sets up very well considering he'll be hitting out towards MLB's 6th-shallowest CF fences in today's matchup. Extreme flyball hitters like Matt Chapman are generally more successful against extreme groundball pitchers like Bryan Hoeing. Matt Chapman has made big gains with his Barrel%, upping his 12.9% rate last year to 18.3% this season. Matt Chapman has put up a .360 Expected wOBA (xwOBA) this year, grading out in the 86th percentile for offensive skills (according to THE BAT X's interpretation of Statcast data).
Santiago Espinal Total Hits Props • Toronto
LoanDepot Park has the shallowest centerfield dimensions among all parks. Santiago Espinal has put up a .268 Expected Batting Average since the start of last season, checking in at the 79th percentile (according to THE BAT X's interpretation of Statcast data). Santiago Espinal has exhibited favorable plate discipline since the start of last season, ranking in the 84th percentile with a 1.92 K/BB rate.
Garrett Cooper Total Hits Props • Miami
THE BAT X projects Garrett Cooper as the 14th-best hitter in Major League Baseball when estimating his BABIP ability. Garrett Cooper is projected to bat 4th on the lineup card in this game. Garrett Cooper will benefit from the home field advantage today, which should improve all of his stats. Garrett Cooper has seen a significant gain in his exit velocity this season; just compare his 91.8-mph average to last year's 89.5-mph figure. Garrett Cooper's ability to hit the ball at a HR-optimizing launch angle (between 23° and 34°) has improved from last year to this one, increasing from 14.3% to 19.3%.
Alejandro Kirk Total Hits Props • Toronto
THE BAT X projects Alejandro Kirk in the 92nd percentile when assessing his batting average talent. Alejandro Kirk has primarily hit in the back-half of the lineup this season (78% of the time), but he is projected to bat 5th on the lineup card in this matchup. Alejandro Kirk has been unlucky this year, compiling a .299 wOBA despite THE BAT X estimating his true talent level to be .339 — a .040 disparity. Alejandro Kirk has shown favorable plate discipline this year, checking in at the 95th percentile with a 1.18 K/BB rate.
Jorge Soler Total Hits Props • Miami
Jorge Soler projects as the 17th-best hitter in the majors, via THE BAT X. Jorge Soler is penciled in 2nd on the lineup card in this game. Jorge Soler will have the benefit of the home field advantage in today's matchup, which ought to boost all of his stats. Jorge Soler has made sizeable improvements with his Barrel%, improving his 12.2% rate last year to 18% this season. Jorge Soler's ability to hit the ball at a HR-optimizing launch angle (between 23° and 34°) has increased from last year to this one, rising from 13.8% to 23.8%.
Jesus Sanchez Total Hits Props • Miami
Jesus Sanchez is projected to bat 5th in the batting order today. Jesus Sanchez will have the benefit of the platoon advantage against Jose Berrios in today's game. The Toronto Blue Jays have just 1 same-handed RP in their bullpen, so Jesus Sanchez can likely count on never facing a bullpen mismatch all game. Jesus Sanchez will possess the home field advantage in today's game, which should improve all of his stats. Jesus Sanchez's ability to hit the ball at a BABIP-maximizing launch angle (between -4° and 26°) has increased from last season to this one, rising from 41.2% to 51.8%.
Nick Fortes Total Hits Props • Miami
Nick Fortes will hold the home field advantage today, which figures to improve all of his stats. Nick Fortes has been unlucky this year, notching a .275 wOBA despite THE BAT X estimating his true talent level to be .313 — a .038 gap.
Joey Wendle Total Hits Props • Miami
THE BAT X projects Joey Wendle in the 76th percentile as it relates to his batting average skill. Joey Wendle will have the benefit of the platoon advantage against Jose Berrios in today's game. The Toronto Blue Jays have just 1 same-handed RP in their bullpen, so Joey Wendle can likely count on never losing the platoon advantage against the 'pen all game. Joey Wendle will possess the home field advantage today, which ought to bolster all of his stats. Joey Wendle has seen a big gain in his exit velocity on flyballs this season; just compare his 92.5-mph average to last season's 86.4-mph figure.
Jacob Stallings Total Hits Props • Miami
Jacob Stallings will have the benefit of the home field advantage in today's matchup, which figures to boost all of his stats. Jacob Stallings has made big strides with his Barrel%, bettering his 3.4% rate last year to 8.7% this season. Jacob Stallings has seen a sizeable gain in his exit velocity this season; just compare his 89.9-mph average to last season's 86.7-mph average. Jacob Stallings has experienced some negative variance in regards to his wOBA this year; his .221 rate is a good deal lower than his .263 Expected wOBA (based on THE BAT X's interpretation of Statcast data).
Luis Arraez Total Hits Props • Miami
Luis Arraez has gone over 1.5 in 4 of his last 10 games.
Vladimir Guerrero Jr. Total Hits Props • Toronto
Vladimir Guerrero Jr. has gone over 1.5 in 3 of his last 10 games.
Jon Berti Total Hits Props • Miami
Jon Berti has gone over 0.5 in 6 of his last 10 games.
Bo Bichette Total Hits Props • Toronto
Bo Bichette has gone over 1.5 in 6 of his last 10 games.
TOR vs MIA Trends
 Toronto Trends
The Toronto Blue Jays have hit the 1st Five Innings (F5) Team Total Under in 25 of their last 38 games (+10.25 Units / 23% ROI)
The Toronto Blue Jays have hit the Team Total Under in 31 of their last 45 games (+15.95 Units / 30% ROI)
The Toronto Blue Jays have hit the Game Total Under in 13 of their last 20 games (+6.35 Units / 29% ROI)
The Toronto Blue Jays have hit the Moneyline in 12 of their last 20 games (+2.65 Units / 10% ROI)
The Toronto Blue Jays have covered the 1st Five Innings (F5) Run Line in 15 of their last 28 away games (+0.30 Units / 1% ROI)
The Toronto Blue Jays have only hit the Team Total Over in 22 of their last 62 games (-23.00 Units / -32% ROI)
The Toronto Blue Jays have only covered the Run Line in 17 of their last 47 games (-15.70 Units / -27% ROI)
The Toronto Blue Jays have only hit the 1st Five Innings (F5) Team Total Over in 13 of their last 38 games (-15.45 Units / -34% ROI)
The Toronto Blue Jays have only hit the 1st Five Innings (F5) Moneyline in 11 of their last 34 games (-13.45 Units / -29% ROI)
The Toronto Blue Jays have only hit the Game Total Over in 26 of their last 62 games (-10.00 Units / -15% ROI)
 Miami Trends
The Miami Marlins have hit the Moneyline in 40 of their last 70 games (+10.55 Units / 12% ROI)
The Miami Marlins have hit the 1st Five Innings (F5) Moneyline in 21 of their last 39 games (+12.50 Units / 24% ROI)
The Miami Marlins have covered the 1st Five Innings (F5) Run Line in 26 of their last 39 games (+10.15 Units / 21% ROI)
The Miami Marlins have covered the Run Line in 16 of their last 21 games (+9.80 Units / 35% ROI)
The Miami Marlins have hit the 1st Five Innings (F5) Team Total Over in 14 of their last 20 games at home (+7.75 Units / 34% ROI)
The Miami Marlins have only hit the Team Total Under in 23 of their last 56 games (-12.90 Units / -20% ROI)
The Miami Marlins have only hit the 1st Five Innings (F5) Team Total Under in 6 of their last 20 games at home (-11.05 Units / -44% ROI)
The Miami Marlins have only hit the Game Total Over in 31 of their last 71 games (-10.60 Units / -14% ROI)
TOR vs MIA Top User Picks
Toronto Team Leaders
| Rank | Leader | L10 | Units |
|---|---|---|---|
| 1 | hackorama | 6-4-0 | +19495 |
| 2 | accxmass | 5-4-1 | +17505 |
| 3 | Midway28 | 5-4-1 | +15885 |
| 4 | CastlemontDB91 | 6-3-1 | +15740 |
| 5 | Rossi35 | 7-3-0 | +15250 |
| 6 | CitoGMoney | 3-6-1 | +14955 |
| 7 | Kowalabear1994 | 7-3-0 | +14035 |
| 8 | rapa76 | 7-3-0 | +13985 |
| 9 | captty55 | 4-6-0 | +12990 |
| 10 | sailorman1965 | 8-2-0 | +12945 |
| All Blue Jays Money Leaders | |||
Miami Team Leaders
| Rank | Leader | L10 | Units |
|---|---|---|---|
| 1 | MatroxSD | 7-3-0 | +33200 |
| 2 | JayAcosta20 | 5-5-0 | +28490 |
| 3 | chuluckus | 3-6-1 | +28010 |
| 4 | Alexandr1966 | 6-4-0 | +26360 |
| 5 | northlv6238 | 6-3-1 | +23335 |
| 6 | ewatson15 | 6-4-0 | +22000 |
| 7 | Forkball1 | 7-3-0 | +20245 |
| 8 | purple_stars | 6-4-0 | +16950 |
| 9 | dogeatdog | 6-4-0 | +16115 |
| 10 | jwwong | 8-2-0 | +16110 |
| All Marlins Money Leaders | |||


