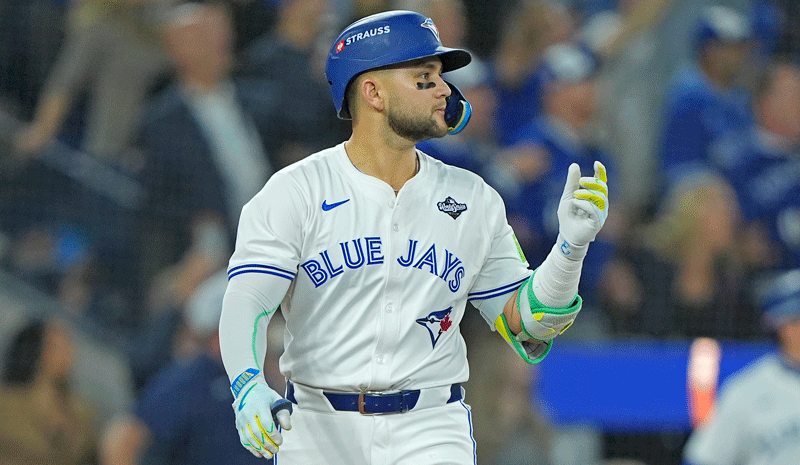
Arizona @ San Diego Picks & Props
AZ vs SD Picks
MLB PicksCheck out all baseball picks and predictions
Latest headlines Checkout latest headlinesRead more
AZ vs SD Consensus Picks
 61% picking San Diego
Total PicksAZ 300, SD 470
66% picking Arizona vs San Diego to go Over
Total PicksAZ 339, SD 177
AZ vs SD Props
Joc Pederson Total Hits Props • Arizona
The leading projection system (THE BAT X) projects Joc Pederson in the 96th percentile when it comes to his overall offensive talent. Joc Pederson is projected to hit 3rd in the batting order in today's game. Joc Pederson will hold the platoon advantage over Randy Vasquez in today's matchup. Over the last 14 days, Joc Pederson has been performing exceptionally well at the plate with a wOBA of .386. Utilizing Statcast metrics, Joc Pederson ranks in the 93rd percentile for offensive skills per the leading projection system (THE BAT X)'s version of Expected wOBA (xwOBA) since the start of last season at .367.
Kevin Newman Total Hits Props • Arizona
Kevin Newman's batting average talent is projected to be in the 79th percentile according to the leading projection system (THE BAT X). By putting up a .339 Expected wOBA (or xwOBA, an advanced metric created by the leading projection system (THE BAT X) using Statcast data) since the start of last season, Kevin Newman has performed in the 80th percentile for offensive ability. Kevin Newman has compiled a .309 Expected Batting Average since the start of last season, placing in the 98th percentile according to the leading projection system (THE BAT X)'s interpretation of Statcast data. Kevin Newman ranks in the 93rd percentile when it comes to hitting balls between -4° and 26°, the launch angle range that tends to optimize base hits (50.8% rate since the start of last season).
Ha-Seong Kim Total Hits Props • San Diego
Ha-seong Kim hits a lot of his flyballs to center field (38.3% — 81st percentile) and will have a big advantage facing the league's 2nd-shallowest CF fences in today's matchup. Home field advantage typically boosts batter stats in all categories, and Ha-seong Kim will hold that advantage in today's matchup. In terms of his batting average, Ha-seong Kim has had bad variance on his side this year. His .221 BA falls considerably below the leading projection system (THE BAT X)'s version of Statcast-based Expected Batting Average (xBA) at .266. Ha-seong Kim has exhibited favorable plate discipline this year, placing in the 96th percentile with a 1.22 K/BB rate.
Tyler Wade Total Hits Props • San Diego
The 3rd-shallowest centerfield dimensions in MLB are found in Petco Park. Tyler Wade will receive the benefit of the platoon advantage against Slade Cecconi in today's matchup. Extreme groundball batters like Tyler Wade generally hit better against extreme flyball pitchers like Slade Cecconi. Tyler Wade will benefit from the home field advantage in today's game, which ought to boost all of his stats.
Pavin Smith Total Hits Props • Arizona
Hitting from the opposite that Randy Vasquez throws from, Pavin Smith will have an advantage today. Pavin Smith hits many of his flyballs to center field (39.6% — 97th percentile) and sets up very well considering he'll be hitting out towards the game's 2nd-shallowest CF fences today. Pavin Smith has been great at making hard contact. If you were to take the top 5% of his batted balls by exit velocity, their average (108.6 mph) put him among the game's best: in the 76th percentile since the start of last season. When it comes to plate discipline, Pavin Smith's skill is quite impressive, sporting a 1.44 K/BB rate since the start of last season while placing in in the 93rd percentile.
Lourdes Gurriel Jr. Total Hits Props • Arizona
Lourdes Gurriel Jr.'s batting average skill is projected to be in the 94th percentile according to the leading projection system (THE BAT X). Lourdes Gurriel Jr. is projected to hit 5th in the lineup in this matchup. The 3rd-shallowest centerfield dimensions in MLB are found in Petco Park. Lourdes Gurriel Jr. has suffered from bad luck when it comes to his wOBA this year; his .291 rate is a fair amount lower than his .396 Expected wOBA, based on the leading projection system (THE BAT X)'s interpretation of Statcast data.
Jurickson Profar Total Hits Props • San Diego
Jurickson Profar is projected to bat 3rd on the lineup card in this game. Jurickson Profar will hold the home field advantage in today's game, which ought to boost all of his stats. Jurickson Profar's quickness has increased this year. His 25.68 ft/sec Statcast Sprint Speed last season sits at 26.62 ft/sec now. In terms of plate discipline, Jurickson Profar's skill is quite good, putting up a 1.11 K/BB rate this year while placing in in the 97th percentile. In notching a .317 batting average this year, Jurickson Profar finds himself in the 96th percentile.
Fernando Tatis Jr. Total Hits Props • San Diego
The #4 venue in baseball for suppressing base hits to right-handed batters, via the leading projection system (THE BAT), is Petco Park. Built just 14 feet above sea level, Petco Park has one of the lowest elevations among all major league stadiums, which generally leads to less offense. The weather report projects the 6th-most favorable pitching weather of all games on the slate today, as it relates to temperature and humidity. Batting from the same side that Slade Cecconi throws from, Fernando Tatis Jr. faces a tough challenge in today's game. Fernando Tatis Jr.'s speed has declined this year. His 29.27 ft/sec Statcast Sprint Speed last season sits at 28.78 ft/sec now.
Luis Arraez Total Hits Props • San Diego
The #4 park in baseball for suppressing base hits to left-handed batters, per the leading projection system (THE BAT), is Petco Park. Built just 14 feet above sea level, Petco Park has one of the lowest elevations among all major league stadiums, which generally leads to less offense. The weather report projects the 6th-most favorable pitching weather of all games on the slate today, as it relates to temperature and humidity. Since the start of last season, Luis Arraez's 3.5% Barrel%, a reliable stat for measuring power, places him in the 10th percentile among his peers. Luis Arraez's maximum exit velocity (a reliable metric to measure power) has been 104 mph since the start of last season, ranking in the 1st percentile.
Jackson Merrill Total Hits Props • San Diego
Jackson Merrill is projected to hit 6th on the lineup card in today's game. The #4 park in baseball for suppressing base hits to left-handed batters, per the leading projection system (THE BAT), is Petco Park. Built just 14 feet above sea level, Petco Park has one of the lowest elevations among all major league stadiums, which generally leads to less offense. The weather report projects the 6th-most favorable pitching weather of all games on the slate today, as it relates to temperature and humidity. Jackson Merrill has been cold in recent games, limping his way to a .282 wOBA in the past two weeks' worth of games.
Jake McCarthy Total Hits Props • Arizona
The leading projection system (THE BAT X) projects Jake McCarthy in the 84th percentile as it relates to his BABIP skill. The 3rd-shallowest centerfield dimensions in MLB are found in Petco Park. Jake McCarthy will have the handedness advantage against Randy Vasquez today. With a .271 batting average this year, Jake McCarthy has performed in the 77th percentile.
Christian Walker Total Hits Props • Arizona
When estimating his overall offensive skill, Christian Walker ranks in the 91st percentile according to the leading projections (THE BAT X). Christian Walker is penciled in 4th on the lineup card in this matchup. The 3rd-shallowest centerfield dimensions in MLB are found in Petco Park. Based on Statcast data, the leading projection system (THE BAT X)'s version of Expected Batting Average (.280) may lead us to conclude that Christian Walker has had bad variance on his side this year with his .259 actual batting average. Since the start of last season, Christian Walker's 11.5% Barrel%, an advanced standard for measuring power, places him in the 78th percentile among his peers.
Gabriel Moreno Total Hits Props • Arizona
The leading projection system (THE BAT X) projects Gabriel Moreno in the 91st percentile when it comes to his batting average skill. Gabriel Moreno hits a lot of his flyballs to center field (39.6% — 97th percentile) and will have a big advantage facing the game's 2nd-shallowest CF fences in today's matchup. Gabriel Moreno has compiled a .283 Expected Batting Average since the start of last season, checking in at the 86th percentile according to the leading projection system (THE BAT X)'s interpretation of Statcast data. Gabriel Moreno has been very good at hitting the ball to all fields (a key ability for batting average), placing in the 94th percentile in THE BAT X's Spray Score since the start of last season. When it comes to plate discipline, Gabriel Moreno's skill is quite good, putting up a 1.62 K/BB rate this year while placing in in the 86th percentile.
Eugenio Suárez Total Hits Props • Arizona
When it comes to his overall offensive ability, Eugenio Suarez ranks in the 79th percentile according to the leading projections (THE BAT X). The 3rd-shallowest centerfield dimensions in MLB are found in Petco Park. The leading projection system (THE BAT X) estimates Eugenio Suarez's true offensive talent to be a .318, suggesting that he has suffered from bad luck this year given the .062 disparity between that mark and his actual .256 wOBA. Since the start of last season, Eugenio Suarez's 12.5% Barrel%, an advanced standard for measuring power, places him in the 84th percentile among his peers. Eugenio Suarez and his 20.4° launch angle on his highest exit velocity balls rank in 98th percentile, among the highest in the game since the start of last season.
Ketel Marte Total Hits Props • Arizona
As it relates to his overall offensive skill, Ketel Marte ranks in the 95th percentile according to the leading projections (THE BAT X). Ketel Marte is penciled in 2nd in the lineup in this game. As it relates to his batting average, Ketel Marte has had some very poor luck this year. His .280 rate falls considerably below the leading projection system (THE BAT X)'s version of Statcast-based Expected Batting Average (xBA) at .284. Ketel Marte's maximum exit velocity (an advanced stat to study power) has been 117.1 mph since the start of last season, placing in the 97th percentile. Ketel Marte has put up a .357 wOBA (the best measure of overall offense) this year, checking in at the 88th percentile.
Corbin Carroll Total Hits Props • Arizona
As it relates to his overall offensive ability, Corbin Carroll ranks in the 91st percentile according to the leading projections (THE BAT X). Corbin Carroll is penciled in 1st in the batting order in this game. The 3rd-shallowest centerfield dimensions in MLB are found in Petco Park. Corbin Carroll will receive the benefit of the platoon advantage against Randy Vasquez in today's game. The leading projection system (THE BAT X) estimates Corbin Carroll's true offensive talent to be a .334, suggesting that he has been unlucky this year given the .081 difference between that figure and his actual .253 wOBA.
Luis Campusano Total Hits Props • San Diego
Luis Campusano hits a lot of his flyballs to center field (38.4% — 83rd percentile) and sets up very well considering he'll be hitting out towards the league's 2nd-shallowest CF fences in today's matchup. Home field advantage generally bolsters hitter metrics in all categories, and Luis Campusano will hold that advantage in today's game. Based on Statcast metrics, the leading projection system (THE BAT X)'s version of Expected Batting Average (.244) suggests that Luis Campusano has had bad variance on his side this year with his .222 actual batting average. When it comes to hitting balls between 23° and 34° (the launch angle range that tends to best-produce home runs), Luis Campusano and his 19.3% rank in the 85th percentile since the start of last season.
Kyle Higashioka Total Hits Props • San Diego
The 3rd-shallowest centerfield dimensions in MLB are found in Petco Park. Kyle Higashioka will possess the home field advantage in today's game, which should improve all of his stats. Kyle Higashioka's 11.1% Barrel% (an advanced stat to measure power) is in the 79th percentile since the start of last season. Since the start of last season, Kyle Higashioka's flyball exit velocity (a reliable stat to study power) grades out in the 77th percentile at 94 mph.
Jake Cronenworth Total Hits Props • San Diego
Jake Cronenworth is projected to bat 4th in the batting order today. The 3rd-shallowest centerfield dimensions in MLB are found in Petco Park. Batting from the opposite that Slade Cecconi throws from, Jake Cronenworth will have the upper hand today. Jake Cronenworth will possess the home field advantage in today's matchup, which ought to improve all of his stats. When it comes to his batting average, Jake Cronenworth has experienced some negative variance this year. His .254 figure falls considerably below the leading projection system (THE BAT X)'s version of Statcast-based Expected Batting Average (xBA) at .296.
David Peralta Total Hits Props • San Diego
David Peralta is projected to hit 5th in the lineup in today's game, which would be an upgrade from his 100% rate of hitting in the bottom-half of the batting order this year. Hitting from the opposite that Slade Cecconi throws from, David Peralta will have an edge in today's matchup. David Peralta hits many of his flyballs to center field (38.4% — 83rd percentile) and is fortunate to face the game's 2nd-shallowest CF fences in today's matchup. Home field advantage generally boosts hitter metrics across the board, and David Peralta will hold that advantage today. Based on Statcast metrics, the leading projection system (THE BAT X)'s version of Expected wOBA (.331) may lead us to conclude that David Peralta has been unlucky since the start of last season with his .284 actual wOBA.
AZ vs SD Trends
 Arizona Trends
The Arizona Diamondbacks have hit the Team Total Under in 32 of their last 53 games (+8.65 Units / 14% ROI)
The Arizona Diamondbacks have hit the Game Total Under in 32 of their last 59 games (+4.85 Units / 8% ROI)
The Arizona Diamondbacks have hit the 1st Five Innings (F5) Team Total Over in 9 of their last 11 away games (+6.65 Units / 46% ROI)
The Arizona Diamondbacks have hit the Moneyline in 9 of their last 16 away games (+4.20 Units / 25% ROI)
The Arizona Diamondbacks have hit the 1st Five Innings (F5) Moneyline in 15 of their last 31 away games (+3.65 Units / 10% ROI)
The Arizona Diamondbacks have only covered the Run Line in 20 of their last 53 games (-16.65 Units / -24% ROI)
The Arizona Diamondbacks have only hit the Team Total Over in 21 of their last 53 games (-16.25 Units / -26% ROI)
The Arizona Diamondbacks have only covered the 1st Five Innings (F5) Run Line in 20 of their last 50 games (-13.15 Units / -23% ROI)
The Arizona Diamondbacks have only hit the Game Total Over in 25 of their last 59 games (-10.40 Units / -16% ROI)
 San Diego Trends
The San Diego Padres have hit the 1st Five Innings (F5) Team Total Under in 11 of their last 13 games at home (+9.20 Units / 57% ROI)
The San Diego Padres have hit the Team Total Under in 18 of their last 27 games at home (+8.10 Units / 26% ROI)
The San Diego Padres have covered the Run Line in 19 of their last 33 games (+6.40 Units / 15% ROI)
The San Diego Padres have hit the Game Total Under in 8 of their last 11 games (+4.80 Units / 40% ROI)
The San Diego Padres have hit the Moneyline in 3 of their last 5 games at home (+0.10 Units / 1% ROI)
The San Diego Padres have only hit the 1st Five Innings (F5) Moneyline in 8 of their last 30 games at home (-18.95 Units / -42% ROI)
The San Diego Padres have only hit the 1st Five Innings (F5) Team Total Over in 8 of their last 30 games at home (-18.40 Units / -51% ROI)
The San Diego Padres have only covered the 1st Five Innings (F5) Run Line in 9 of their last 30 games at home (-16.65 Units / -46% ROI)
The San Diego Padres have only hit the Team Total Over in 9 of their last 27 games at home (-12.15 Units / -37% ROI)
The San Diego Padres have only hit the Game Total Over in 27 of their last 58 games (-6.80 Units / -11% ROI)
AZ vs SD Top User Picks
Arizona Team Leaders
| Rank | Leader | L10 | Units |
|---|---|---|---|
| 1 | anya | 7-3-0 | +19170 |
| 2 | PlusOdds | 3-6-1 | +17545 |
| 3 | Bassboy7276 | 6-4-0 | +15647 |
| 4 | uncle_Pasha_DRW | 4-5-1 | +13772 |
| 5 | vitom | 6-3-1 | +13655 |
| 6 | mccabecj | 4-6-0 | +13555 |
| 7 | timstutler25 | 4-6-0 | +12860 |
| 8 | drizrazz | 5-3-2 | +12715 |
| 9 | hoody | 8-2-0 | +12370 |
| 10 | Brayy_Wyatt | 5-5-0 | +12265 |
| All Diamondbacks Money Leaders | |||
San Diego Team Leaders
| Rank | Leader | L10 | Units |
|---|---|---|---|
| 1 | Sabster611 | 9-1-0 | +23405 |
| 2 | Infinite-H | 8-2-0 | +22730 |
| 3 | Bigboys9 | 6-4-0 | +20690 |
| 4 | CJONES1068 | 8-2-0 | +14925 |
| 5 | Enelra18 | 5-5-0 | +13770 |
| 6 | Ollywood | 8-2-0 | +13087 |
| 7 | dude18555 | 5-5-0 | +13040 |
| 8 | vlkvlk2012 | 2-8-0 | +12910 |
| 9 | Moneyman00 | 6-4-0 | +12810 |
| 10 | dawoodman | 9-1-0 | +12745 |
| All Padres Money Leaders | |||


